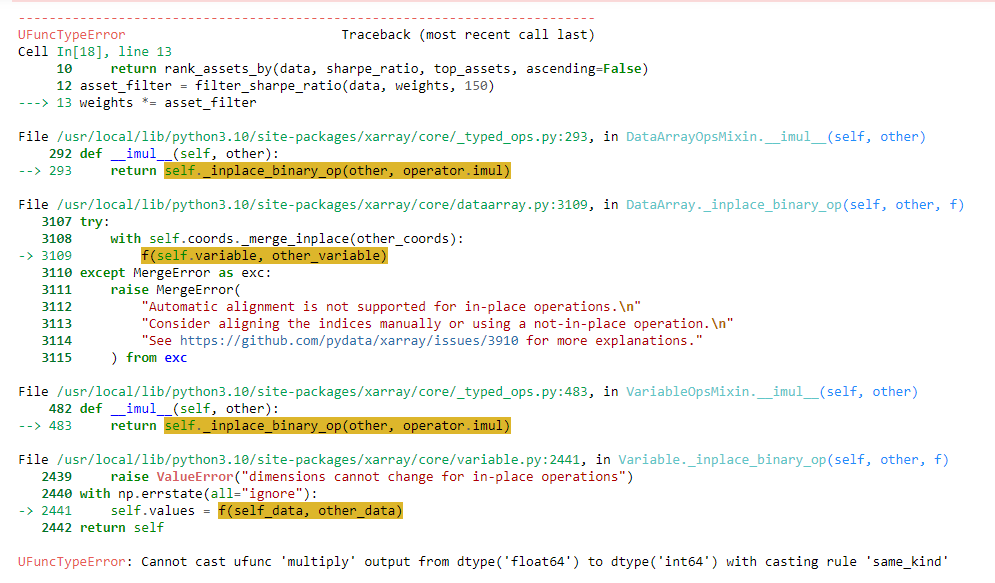
Hi, I'm testing the new ticker filtering methods that Quantiacs provides, but I'm getting the error Cannot cast ufunc 'multiply' output from dtype('float64') to dtype('int64') with casting rule 'same_kind'
This is my code
# Import basic libraries.
import xarray as xr
import pandas as pd
import numpy as np
# Import Quantiacs libraries.
import qnt.data as qndata # load and manipulate data
import qnt.output as qnout # manage output
import qnt.backtester as qnbt # backtester
import qnt.stats as qnstats # statistical functions for analysis
import qnt.graph as qngraph # graphical tools
import qnt.ta as qnta # indicators library
import qnt.xr_talib as xr_talib # indicators library
data = qndata.stocks.load_ndx_data(min_date="2005-06-01")
def filter_volatility(data, rolling_window, top_assets, metric="std", ascending=True):
"""
Filter and rank assets based on volatility over a rolling window.
Args:
data (xarray.Dataset): The dataset containing asset data.
rolling_window (int): Window size for the rolling volatility computation.
top_assets (int): Number of top assets to select.
metric (str): Volatility metric to use ('std' for standard deviation).
ascending (bool): Rank order, True for lowest first.
"""
prices = data.sel(field='close')
daily_returns = prices.diff('time') / prices.shift(time=1)
rolling_volatility = calc_rolling_metric(daily_returns, rolling_window, metric)
volatility_ranks = rank_assets_by(data, rolling_volatility, top_assets, ascending)
return volatility_ranks
def calc_rolling_metric(condition, rolling_window, metric="std"):
"""
Compute a rolling metric (standard deviation or mean) over a specified window for a given condition.
Args:
condition (xarray.DataArray): Data over which the metric is computed.
rolling_window (int): Window size for the rolling computation.
metric (str): Type of metric to compute ('std' for standard deviation, 'mean' for average).
Raises:
ValueError: If an unsupported metric is specified.
"""
if metric == "std":
return condition.rolling({"time": rolling_window}).std()
elif metric == "mean":
return condition.rolling({"time": rolling_window}).mean()
else:
raise ValueError(f"Unsupported metric: {metric}")
def rank_assets_by(data, criterion, top_assets, ascending):
"""
Rank assets based on a specified criterion. Returns a DataArray where top ranked assets are marked with a '1'.
Args:
data (xarray.Dataset): The dataset containing asset data.
criterion (xarray.DataArray): The data based on which assets are ranked.
top_assets (int): Number of top assets to select.
ascending (bool): True for ascending order, False for descending order.
"""
volatility_ranks = xr.DataArray(
np.zeros_like(data.sel(field='close').values),
dims=['time', 'asset'],
coords={'time': data.coords['time'], 'asset': data.coords['asset']}
)
for time in criterion.coords['time'].values:
daily_vol = criterion.sel(time=time)
ranks = (daily_vol if ascending else -daily_vol).rank('asset')
top_assets_indices = ranks.where(ranks <= top_assets, drop=True).asset.values
volatility_ranks.loc[dict(time=time, asset=top_assets_indices)] = 1
return volatility_ranks.fillna(0)
close = data.sel(field="close")
sma_slow = qnta.sma(close, 200)
sma_fast = qnta.sma(close, 20)
weights = xr.where(sma_slow < sma_fast, 1, -1)
def filter_sharpe_ratio(data, weights, top_assets):
stats_per_asset = qnstats.calc_stat(data, weights, per_asset=True)
sharpe_ratio = stats_per_asset.sel(field="sharpe_ratio")
return rank_assets_by(data, sharpe_ratio, top_assets, ascending=False)
asset_filter = filter_sharpe_ratio(data, weights, 150)
weights *= asset_filter
# Liquidity filter and clean
is_liquid = data.sel(field="is_liquid")
weights = weights * is_liquid
weights = qnout.clean(weights, data, "stocks_nasdaq100")
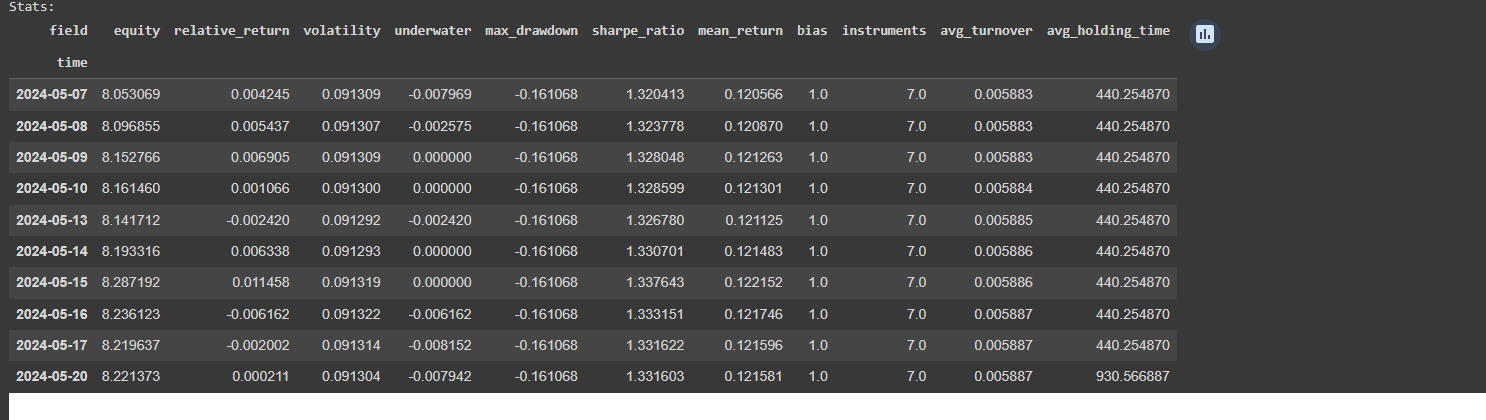
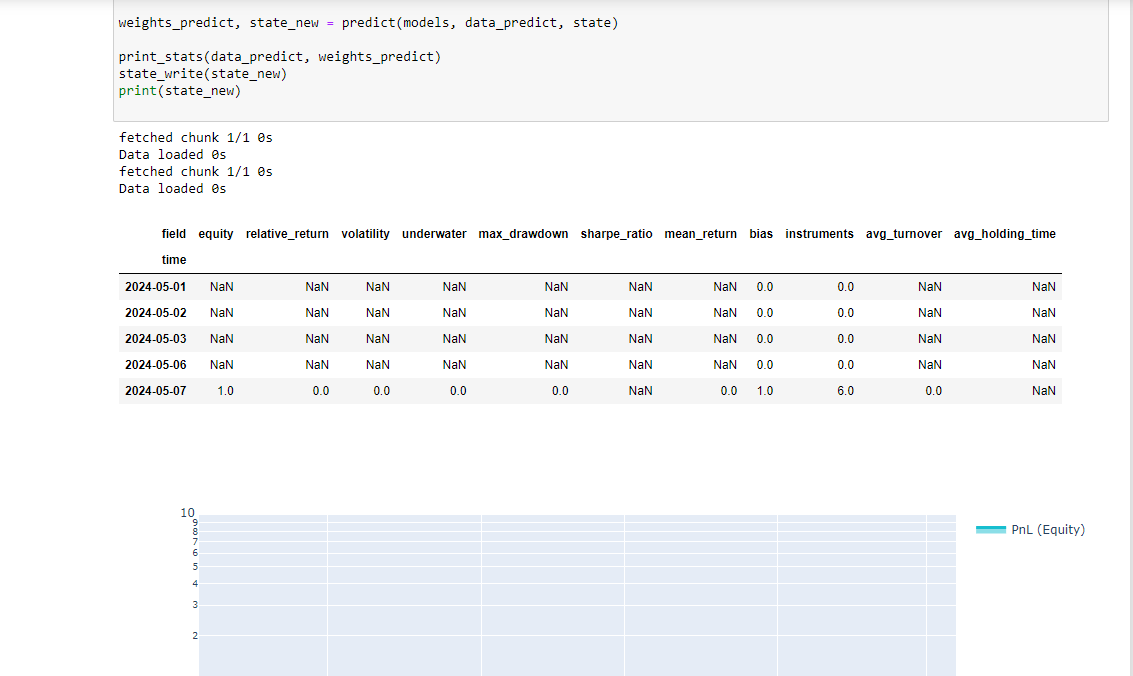
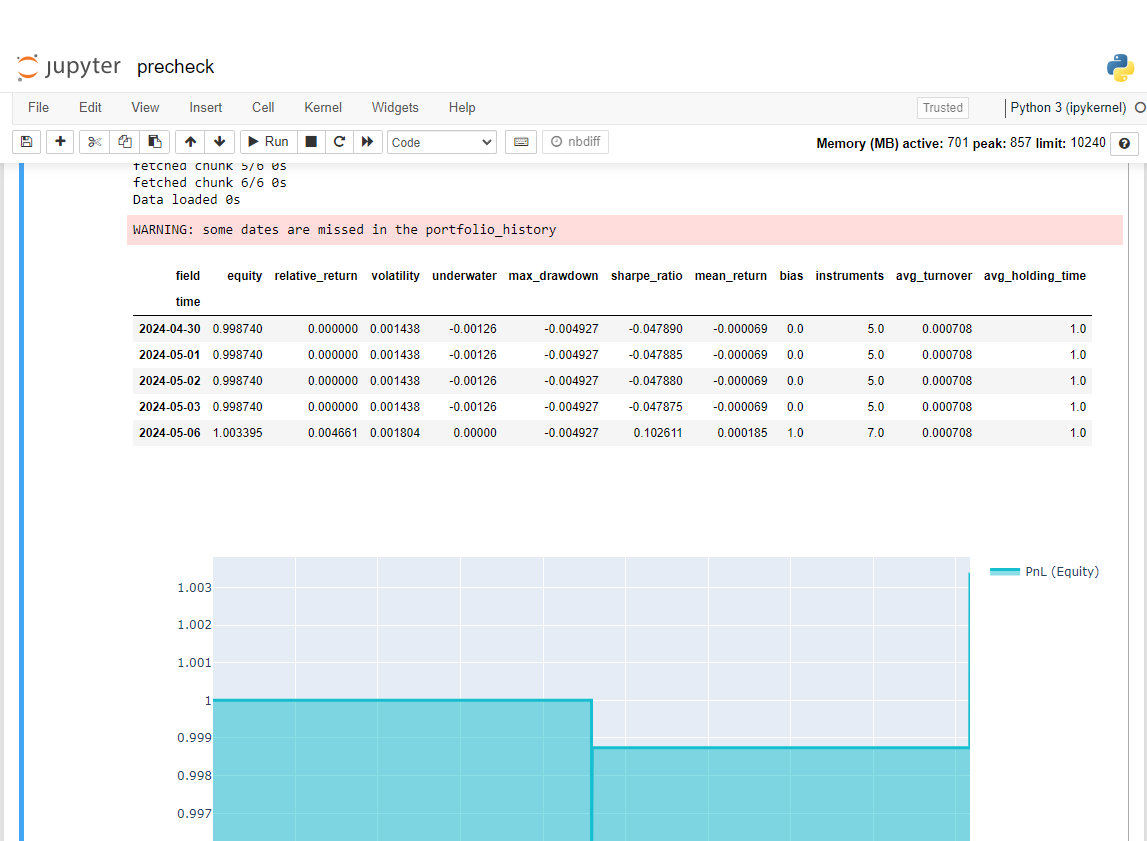
stats = qnstats.calc_stat(data, weights.sel(time=slice("2006-01-01", None)))
display(stats.to_pandas().tail())
performance = stats.to_pandas()["equity"]
qngraph.make_plot_filled(performance.index, performance, name="PnL (Equity)", type="log")
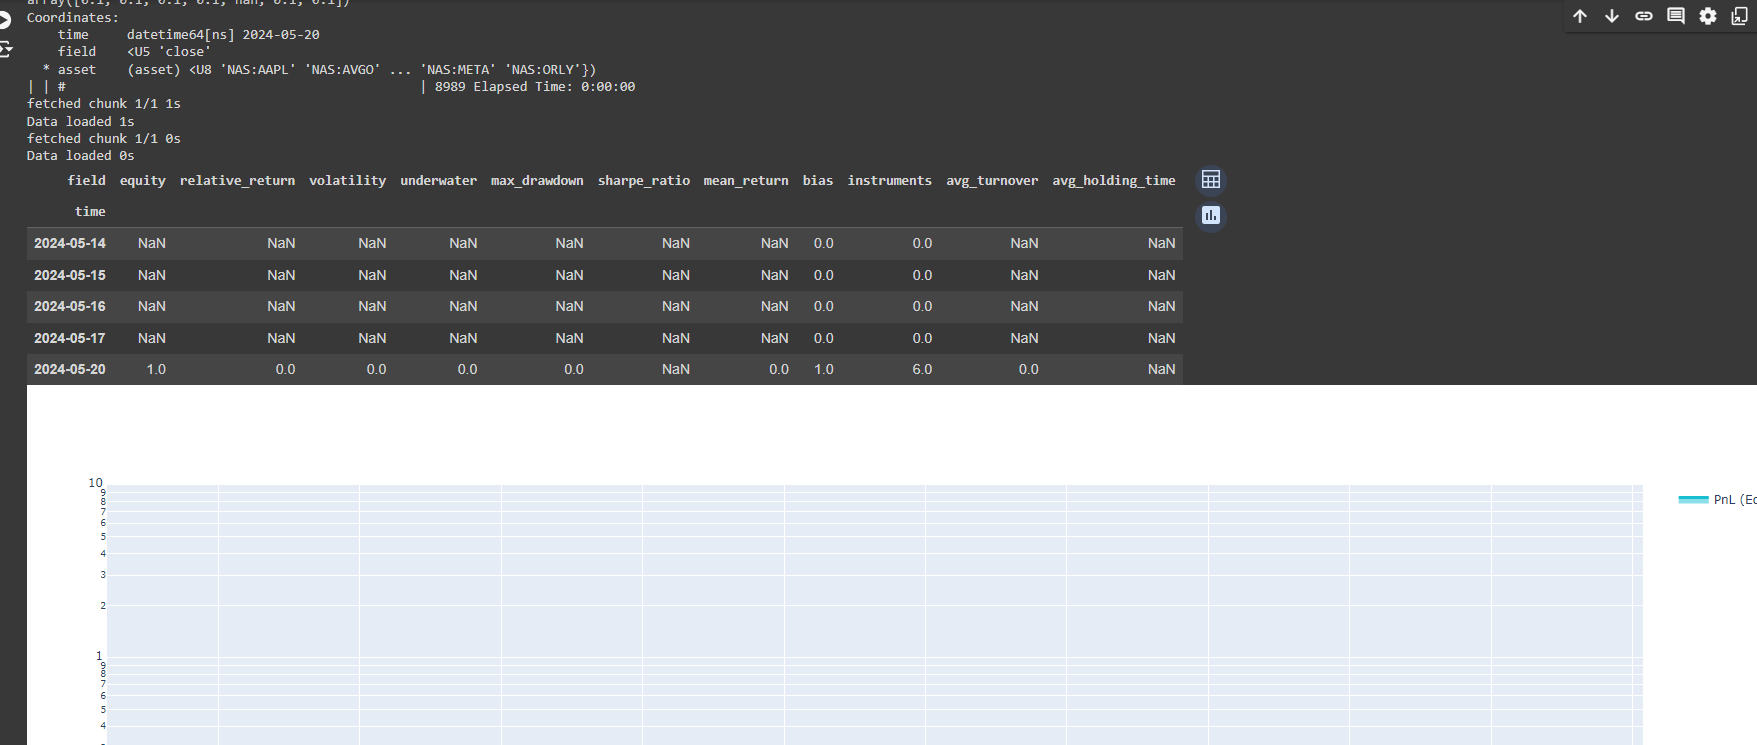
weights = weights.sel(time=slice(date,None))
qnout.check(weights, data, "stocks_nasdaq100")
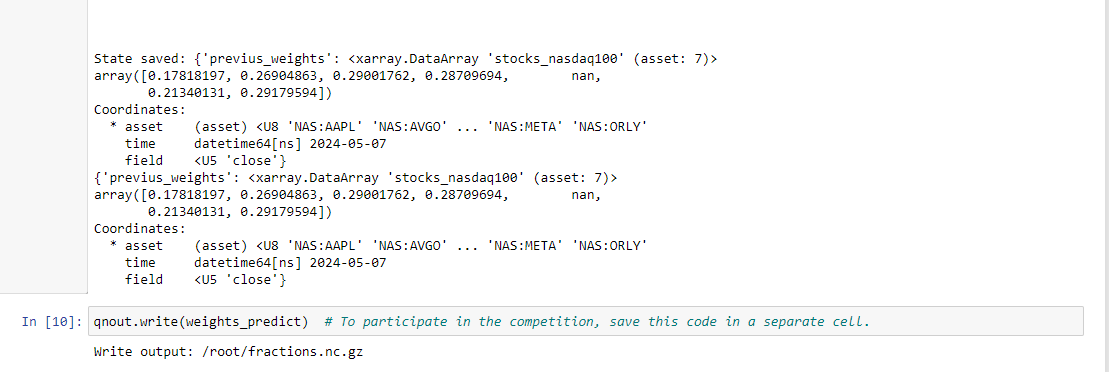
qnout.write(weights) # to participate in the competition
Besides I couldn't import the qnfilter library so I had to call the function directly from the strategy. Looking forward to your support. Thank you
@Vyacheslav_B @support