Navigation

    Quantiacs Community

    • Register
    • Login
    • Search
    • Categories
    • News
    • Recent
    • Tags
    • Popular
    • Users
    • Groups
    1. Home
    2. Vyacheslav_B
    V
    • Profile
    • Following 0
    • Followers 0
    • Topics 3
    • Posts 76
    • Best 18
    • Groups 0
    • Blog

    Vyacheslav_B

    @Vyacheslav_B

    19
    Reputation
    56
    Profile views
    76
    Posts
    0
    Followers
    0
    Following
    Joined Last Online

    Vyacheslav_B Follow

    Best posts made by Vyacheslav_B

    • RE: Different Sharpe Ratios for Multipass-Backtest and Quantiacs Mulipass Backtest

      @magenta-kabuto

      Compare the two versions of the code.

      def regime_trade(series):
          return ""
      
      
      def strategy(data):
          result = regime_trade(data)
          return result
      
      
      backtest(strategy=strategy)
      

      in the first case, the available data for a specific date are used.

      def regime_trade(series):
          return ""
      
      
      result = regime_trade(data)
      
      def strategy(data):
          return result
      
      
      backtest(strategy=strategy)
      

      in the second case, all data is used.

      I see that you have a very large Sharpe ratio, I think that you are using something similar to the second option.

      posted in Support
      V
      Vyacheslav_B
    • RE: Machine Learning Strategy

      @spancham Hello. Try this

      import xarray as xr
      
      import qnt.backtester as qnbt
      import qnt.data as qndata
      import numpy as np
      import pandas as pd
      import logging
      
      
      def load_data(period):
          return qndata.cryptofutures.load_data(tail=period)
      
      
      def predict_weights(market_data):
      
          def get_ml_model():
              # you can use any machine learning model
              from sklearn.linear_model import RidgeClassifier
              model = RidgeClassifier(random_state=18)
              return model
      
          def get_features_dict(data):
              def get_features_for(asset_name):
                  data_for_instrument = data.copy(True).sel(asset=[asset_name])
      
                  # Feature 1
                  price = data_for_instrument.sel(field="close").ffill('time').bfill('time').fillna(0)  # fill NaN
                  price_df = price.to_dataframe()
      
                  # Feature 2
                  vol = data_for_instrument.sel(field="vol").ffill('time').bfill('time').fillna(0)  # fill NaN
                  vol_df = vol.to_dataframe()
      
                  # Merge dataframes
                  for_result = pd.merge(price_df, vol_df, on='time')
                  for_result = for_result.drop(['field_x', 'field_y'], axis=1)
      
                  return for_result
      
              features_all_assets = {}
      
              asset_all = data.asset.to_pandas().to_list()
              for asset in asset_all:
                  features_all_assets[asset] = get_features_for(asset)
      
              return features_all_assets
      
          def get_target_classes(data):
              # for classifiers, you need to set classes
              # if 1 then the price will rise tomorrow
      
              price_current = data.sel(field="close").dropna('time')  # rm NaN
              price_future = price_current.shift(time=-1).dropna('time')
      
              class_positive = 1
              class_negative = 0
      
              target_is_price_up = xr.where(price_future > price_current, class_positive, class_negative)
              return target_is_price_up.to_pandas()
      
          data = market_data.copy(True)
      
          asset_name_all = data.coords['asset'].values
          features_all_df = get_features_dict(data)
          target_all_df = get_target_classes(data)
      
          predict_weights_next_day_df = data.sel(field="close").isel(time=-1).to_pandas()
      
          for asset_name in asset_name_all:
              target_for_learn_df = target_all_df[asset_name]
              feature_for_learn_df = features_all_df[asset_name][:-1]  # last value reserved for prediction
      
              # align features and targets
              target_for_learn_df, feature_for_learn_df = target_for_learn_df.align(feature_for_learn_df, axis=0,
                                                                                    join='inner')
      
              model = get_ml_model()
              try:
                  model.fit(feature_for_learn_df.values, target_for_learn_df)
      
                  feature_for_predict_df = features_all_df[asset_name][-1:]
      
                  predict = model.predict(feature_for_predict_df.values)
                  predict_weights_next_day_df[asset_name] = predict
              except:
                  logging.exception("model failed")
                  # if there is exception, return zero values
                  return xr.zeros_like(data.isel(field=0, time=0))
      
          return predict_weights_next_day_df.to_xarray()
      
      
      weights = qnbt.backtest(
          competition_type="cryptofutures",
          load_data=load_data,
          lookback_period=18,
          start_date='2014-01-01',
          strategy=predict_weights,
          analyze=True,
          build_plots=True
      )


      Here is an example with indicators (Sharpe Ratio = 0.8)

       def get_features_for(asset_name):
          data_for_instrument = data.copy(True).sel(asset=[asset_name])
      
          # Feature 1
          price = data_for_instrument.sel(field="close")
          price = qnt.ta.roc(price, 1)
          price = price.ffill('time').bfill('time').fillna(0)
          price_df = price.to_pandas()
      
          # Feature 2
          vol = data_for_instrument.sel(field="vol")
          vol = vol.ffill('time').bfill('time').fillna(0)  # fill NaN
          vol_df = vol.to_pandas()
      
          # Merge dataframes
          for_result = pd.merge(price_df, vol_df, on='time')
      
          return for_result
      
      
      posted in Strategy help
      V
      Vyacheslav_B
    • RE: Error Q20 output missing when submitting

      @theflyingdutchman

      Hello. try to execute in a separate cell the code which saves weights. This should help.
      As far as I understand, this can happen when there is no data for the first day.
      The cell where the error occurs will be ignored and the next one will be executed.

      qnout.check(weights, data, "stocks_nasdaq100")
      qnout.write(weights)
      
      posted in Strategy help
      V
      Vyacheslav_B
    • RE: Question about the Q17 Machine Learning Example Algo

      @cespadilla Hello.

      The reason is in "train_model" function.

      def train_model(data):
          asset_name_all = data.coords['asset'].values
          features_all = get_features(data)
          target_all = get_target_classes(data)
      
      
          models = dict()
      
          for asset_name in asset_name_all:
      
              # drop missing values:
              target_cur = target_all.sel(asset=asset_name).dropna('time', 'any')
              features_cur = features_all.sel(asset=asset_name).dropna('time', 'any')
              
              
              target_for_learn_df, feature_for_learn_df = xr.align(target_cur, features_cur, join='inner')
              if len(features_cur.time) < 10:
                      continue
              model = get_model()
              try:
                  model.fit(feature_for_learn_df.values, target_for_learn_df)
                  models[asset_name] = model
      
                      
              except:
                  logging.exception('model training failed')
      
          return models
      

      If there are less than 10 features for training the model, then the model is not created (if len(features_cur.time) < 10).

      This condition makes sense. I would not remove it.

      The second thing that can affect is the retraining interval of the model ("retrain_interval").

      
      weights = qnbt.backtest_ml(
          train=train_model,
          predict=predict_weights,
          train_period=2 *365,  # the data length for training in calendar days
          retrain_interval=10 *365,  # how often we have to retrain models (calendar days)
          retrain_interval_after_submit=1,  # how often retrain models after submission during evaluation (calendar days)
          predict_each_day=False,  # Is it necessary to call prediction for every day during backtesting?
          # Set it to true if you suspect that get_features is looking forward.
          competition_type='crypto_daily_long_short',  # competition type
          lookback_period=365,  # how many calendar days are needed by the predict function to generate the output
          start_date='2014-01-01',  # backtest start date
          analyze = True,
          build_plots=True  # do you need the chart?
      )
      
      posted in Strategy help
      V
      Vyacheslav_B
    • RE: Backtesting

      @magenta-kabuto

      Hello

      An example using pandas
      One can work with pandas DataFrames at intermediate steps and at the end convert them to xarray data structures:

      def get_price_pct_change(prices):
          prices_pandas = prices.to_pandas()
          assets = data.coords["asset"].values
          for asset in assets:
              prices_pandas[asset] = prices_pandas[asset].pct_change()
          return prices_pandas
      
      prices = data.sel(field="close") * 1.0
      prices_pct_change = get_price_pct_change(prices).unstack().to_xarray()
      
      posted in Strategy help
      V
      Vyacheslav_B
    • RE: Multi-pass Backtesting

      @eddiee

      Hello.

      This code looks to the future.
      It is needed to train the model.
      Pay attention to the name of the variable.

      posted in Strategy help
      V
      Vyacheslav_B
    • RE: What is forward looking and why it's effective badly to strategy?

      @illustrious-felice Hello. Sometimes an error can occur at the data preprocessing stage. It's possible to inadvertently use future data.

      Quantiacs has an excellent mechanism for quickly checking such errors.

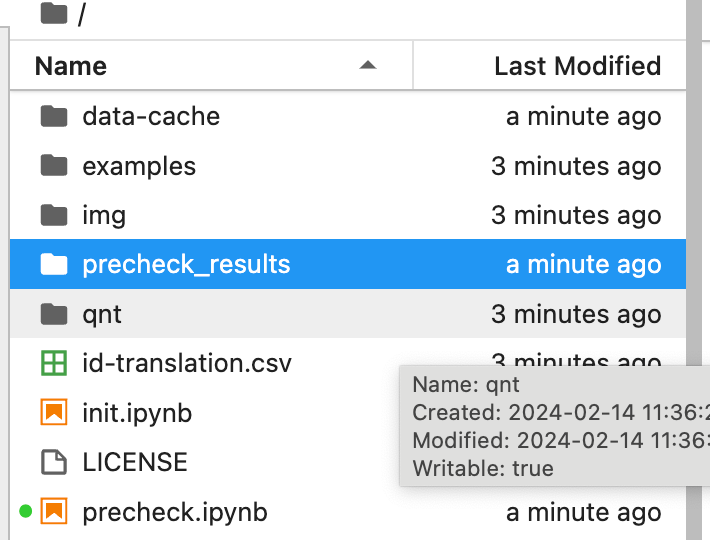
      In any strategy, there is a file:
      https://github.com/quantiacs/toolbox/blob/main/qnt/precheck.ipynb

      Run it on 3-5 splits and compare the statistics. If there are discrepancies, then it is likely that the strategy is peeking into the future.

      If you set a very large number of splits, it will be an example of how the online check of submitted strategies in the contest works.

      Intermediate results can be viewed in HTML format in the folder.
      e38dbf63-d2a4-4a82-ae36-cc6077c1485e-image.png

      posted in Strategy help
      V
      Vyacheslav_B
    • RE: Missed Call to write output

      @magenta-kabuto Hello. If you are developing your strategies in a local environment, I recommend running your strategy code in an online environment before submitting it to the competition.

      There may be errors related to the absence of certain Python libraries in the online environment, the use of local files, and the application of variables or settings from the local environment.

      It is important that the line

      import qnt.output as qnout
      qnout.write(weights)
      

      is placed in a separate cell.

      posted in Strategy help
      V
      Vyacheslav_B
    • RE: Missed Call to write output

      @magenta-kabuto append

      print(state)
      

      before saving it. What are you trying to save?

      you may need to restart the kernel.

      Answer ChatGPT:

      The error message you're encountering, AttributeError: Can't pickle local object 'Layer._initializer_tracker.<locals>.<lambda>', indicates that the pickle module is unable to serialize a lambda function (or possibly another local object) that is part of the object state you're attempting to dump to a file. This is a common limitation of pickle, as it cannot serialize lambda functions, local functions, classes defined within functions, or instances of such classes, among other things.

      Avoid Using Lambda Functions in Serializable Objects
      If possible, replace lambda functions with defined functions (even if they're one-liners). Defined functions can be pickled because they are not considered local objects. For example, if you have:

      lambda x: x + 1
      

      Replace it with:

      def increment(x):
          return x + 1
      
      posted in Strategy help
      V
      Vyacheslav_B
    • RE: backtest_ml has too long a run time

      @illustrious-felice

      Incorporating seed initialization into your PyTorch code ensures reproducibility by making the random number generation predictable. This involves setting seeds for the PyTorch engine, NumPy, and the Python random module if you're using it. Below, I'll show you how to integrate seed initialization into your existing code. Remember, while this can make your experiments more reproducible, it does not guarantee identical results across different hardware or PyTorch versions due to the inherent nondeterminism in some GPU operations.

      import xarray as xr  # xarray for data manipulation
      import qnt.data as qndata  # functions for loading data
      import qnt.backtester as qnbt  # built-in backtester
      import qnt.ta as qnta  # technical analysis library
      import numpy as np
      import pandas as pd
      import torch
      from torch import nn, optim
      import random
      
      # Seed initialization function
      def set_seed(seed_value=42):
          """Set seed for reproducibility."""
          random.seed(seed_value)
          np.random.seed(seed_value)
          torch.manual_seed(seed_value)
          torch.cuda.manual_seed(seed_value)
          torch.cuda.manual_seed_all(seed_value)  # if you are using multi-GPU.
          torch.backends.cudnn.deterministic = True
          torch.backends.cudnn.benchmark = False
      
      # Set the seed for reproducibility
      set_seed(42)
      
      asset_name_all = ['NAS:AAPL', 'NAS:AMZN', 'NAS:MSFT']
      
      class LSTM(nn.Module):
          """
          Class to define our LSTM network.
          """
          def __init__(self, input_dim=3, hidden_layers=64):
              super(LSTM, self).__init__()
              self.hidden_layers = hidden_layers
              self.lstm1 = nn.LSTMCell(input_dim, self.hidden_layers)
              self.lstm2 = nn.LSTMCell(self.hidden_layers, self.hidden_layers)
              self.linear = nn.Linear(self.hidden_layers, 1)
      
          def forward(self, y, future_preds=0):
              outputs = []
              n_samples = y.size(0)
              h_t = torch.zeros(n_samples, self.hidden_layers, dtype=torch.float32)
              c_t = torch.zeros(n_samples, self.hidden_layers, dtype=torch.float32)
              h_t2 = torch.zeros(n_samples, self.hidden_layers, dtype=torch.float32)
              c_t2 = torch.zeros(n_samples, self.hidden_layers, dtype=torch.float32)
      
              for time_step in range(y.size(1)):
                  x_t = y[:, time_step, :]  # Ensure x_t is [batch, input_dim]
      
                  h_t, c_t = self.lstm1(x_t, (h_t, c_t))
                  h_t2, c_t2 = self.lstm2(h_t, (h_t2, c_t2))
                  output = self.linear(h_t2)
                  outputs.append(output.unsqueeze(1))
      
              outputs = torch.cat(outputs, dim=1).squeeze(-1)
              return outputs
      
      def get_model():
          model = LSTM(input_dim=3)
          return model
      
      def get_features(data):
          close_price = data.sel(field="close").ffill('time').bfill('time').fillna(1)
          open_price = data.sel(field="open").ffill('time').bfill('time').fillna(1)
          high_price = data.sel(field="high").ffill('time').bfill('time').fillna(1)
          log_close = np.log(close_price)
          log_open = np.log(open_price)
          features = xr.concat([log_close, log_open, high_price], "feature")
          return features
      
      def get_target_classes(data):
          price_current = data.sel(field='close')
          price_future = qnta.shift(price_current, -1)
      
          class_positive = 1  # prices goes up
          class_negative = 0  # price goes down
      
          target_price_up = xr.where(price_future > price_current, class_positive, class_negative)
          return target_price_up
      
      def load_data(period):
          return qndata.stocks.load_ndx_data(tail=period, assets=asset_name_all)
      
      def train_model(data):
          features_all = get_features(data)
          target_all = get_target_classes(data)
          models = dict()
      
          for asset_name in asset_name_all:
              model = get_model()
              target_cur = target_all.sel(asset=asset_name).dropna('time', 'any')
              features_cur = features_all.sel(asset=asset_name).dropna('time', 'any')
              target_for_learn_df, feature_for_learn_df = xr.align(target_cur, features_cur, join='inner')
              criterion = nn.MSELoss()
              optimiser = optim.LBFGS(model.parameters(), lr=0.08)
              epochs = 1
              for i in range(epochs):
                  def closure():
                      optimiser.zero_grad()
                      feature_data = feature_for_learn_df.transpose('time', 'feature').values
                      in_ = torch.tensor(feature_data, dtype=torch.float32).unsqueeze(0)
                      out = model(in_)
                      target = torch.zeros(1, len(target_for_learn_df.values))
                      target[0, :] = torch.tensor(np.array(target_for_learn_df.values))
                      loss = criterion(out, target)
                      loss.backward()
                      return loss
                  optimiser.step(closure)
              models[asset_name] = model
          return models
      
      def predict(models, data):
          weights = xr.zeros_like(data.sel(field='close'))
          for asset_name in asset_name_all:
              features_all = get_features(data)
              features_cur = features_all.sel(asset=asset_name).dropna('time', 'any')
              if len(features_cur.time) < 1:
                  continue
              feature_data = features_cur.transpose('time', 'feature').values
              in_ = torch.tensor(feature_data, dtype=torch.float32).unsqueeze(0)
              out = models[asset_name](in_)
              prediction = out.detach()[0]
              weights.loc[dict(asset=asset_name, time=features_cur.time.values)] = prediction
          return weights
      
      weights = qnbt.backtest_ml(
          load_data=load_data,
          train=train_model,
          predict=predict,
          train_period=55,
          retrain_interval=55,
          retrain_interval_after_submit=1,
          predict_each_day=False,
          competition_type='stocks_nasdaq100',
          lookback_period=55,
          start_date='2024-01-01',
          build_plots=True
      )


      I think I won't be available next week. If you have any more questions, don’t expect an answer from me next week.
      posted in Strategy help
      V
      Vyacheslav_B

    Latest posts made by Vyacheslav_B

    • RE: ERROR! The max exposure is too high

      @antinomy
      Hi! Don’t worry about leverage — it isn’t allowed on the Quantiacs platform: all user-supplied weights are automatically normalized when your strategy is saved. Here’s how that works with two instruments.
      Source code of the normalize function https://github.com/quantiacs/toolbox/blob/main/qnt/output.py:

      def normalize(output, per_asset=False):
          from qnt.data.common import ds
          output = output.where(np.isfinite(output)).fillna(0)
          if ds.TIME in output.dims:
              output = output.transpose(ds.TIME, ds.ASSET)
              output = output.loc[
                  np.sort(output.coords[ds.TIME].values),
                  np.sort(output.coords[ds.ASSET].values)
              ]
          if per_asset:
              output = xr.where(output > 1, 1, output)
              output = xr.where(output < -1, -1, output)
          else:
              s = abs(output).sum(ds.ASSET)
              if ds.TIME in output.dims:
                  s[s < 1] = 1
              else:
                  s = 1 if s < 1 else s
              output = output / s
          try:
              output = output.drop_vars(ds.FIELD)
          except ValueError:
              pass
          return output
      

      Example with two assets

      import xarray as xr
      from qnt.data.common import ds
      from qnt.output import normalize
      
      times  = ['2025-06-16']
      assets = ['Asset1', 'Asset2']
      
      out1 = xr.DataArray([[1.5, 0.5]],
                          coords={ds.TIME: times, ds.ASSET: assets},
                          dims=[ds.TIME, ds.ASSET])
      print(normalize(out1).values)
      
      out2 = xr.DataArray([[0.3, -0.2]],
                          coords={ds.TIME: times, ds.ASSET: assets},
                          dims=[ds.TIME, ds.ASSET])
      print(normalize(out2).values)
      

      Console output

      [[0.75 0.25]]
      [[ 0.3  -0.2 ]]
      

      Example 1: The absolute exposure is 2 > 1, so every weight is divided by 2, yielding 0.75 and 0.25.

      Example 2: The exposure is 0.5 < 1, so the scaling factor is set to 1 and the weights stay 0.3 and –0.2.

      In short, even if your strategy outputs more than 100 % exposure, normalize always scales it back so the total absolute exposure never exceeds 1—preventing leverage on the Quantiacs platform.

      posted in Support
      V
      Vyacheslav_B
    • RE: ERROR! The max exposure is too high

      @antinomy Hello. If you look at how the function works, it limits exposure based on the invested capital, not the total capital — which is stricter than what's stated in the rules. However, in my opinion, this approach has advantages: strategies end up being more diversified, and you won’t be able to trade with just a few assets.

      posted in Support
      V
      Vyacheslav_B
    • RE: ERROR! The max exposure is too high

      @omohyoid Hi.

      I don’t quite understand why you’re calculating the next trading date manually. According to the documentation and this official example, it works like this:

      Strategy. Weights allocation
      Every day, the algorithm determines how much of each asset should be in the portfolio for the next trading day.
      These are called the portfolio weights.
      A positive weight means you'll be buying that asset, while a negative weight means you'll be selling it.
      These decisions are made at the end of each day and put into effect at the beginning of the next trading day.

      There’s a clear visual example in the notebook showing how this works. So there’s no need to manually add or compute the next date — the platform takes care of that automatically.

      As for the max weights — I didn’t quite understand what the issue is. If you look at the source code of a function like cut_big_positions, you’ll see something like this:

      weights_1 = xr.where(abs(weights) > 0.05, np.sign(weights) * 0.05, weights)
      

      This simply limits all weights that are greater than ±0.05 to exactly ±0.05. So if you’re seeing a value like 0.05882353, it’s likely either before this restriction is applied, or maybe you're looking at a version of the weights before post-processing.

      posted in Support
      V
      Vyacheslav_B
    • RE: Strategy trades illiquid instruments

      @illustrious-felice Hello. The reason you're still seeing a large number of tickers (e.g., around 300) even after applying the filter is that the "best" instrument by Sharpe ratio changes over time. The rank_assets_by function returns a time-dependent mask, selecting the top N assets at each time step. So the total number of unique assets that were selected at any point in time may be much larger than top_assets.

      This is expected behavior.

      To illustrate this more clearly, let's consider a minimal working example that selects only 1 top asset at each point in time and shows all the intermediate steps:

      import qnt.data as qndata
      import qnt.ta as qnta
      import qnt.stats as qnstats
      import qnt.output as qnout
      import qnt.filter as qnfilter
      import xarray as xr
      import pandas as pd
      
      top_assets = 1
      
      data = qndata.stocks.load_spx_data(min_date="2005-06-01")
      weights = data.sel(field="is_liquid")
      
      stats_per_asset = qnstats.calc_stat(data, weights, per_asset=True)
      sharpe_ratio = stats_per_asset.sel(field="sharpe_ratio")
      asset_filter = qnfilter.rank_assets_by(data, sharpe_ratio, top_assets, ascending=False)
      
      weights = weights * asset_filter
      stats = qnstats.calc_stat(data, weights.sel(time=slice("2005-06-01", None)))
      
      display(asset_filter.to_pandas().tail())
      display(stats.to_pandas().tail())
      display(sharpe_ratio.to_pandas().tail())
      display(weights.to_pandas().tail())
      

      If you want to see which asset was the best on specific dates, you can do something like this:

      dates = ["2015-01-15", "2020-01-15", "2025-01-15"]
      records = []
      
      for date_str in dates:
          best_mask = asset_filter.sel(time=date_str)
          assets = best_mask.where(best_mask > 0, drop=True).asset.values
          srs = sharpe_ratio.sel(time=date_str, asset=assets).values
          for a, s in zip(assets, srs):
              records.append({"time": date_str, "asset": a.item(), "sharpe_ratio": float(s)})
      
      df = pd.DataFrame(records).set_index("time")
      display(df)
      
      asset	sharpe_ratio
      time		
      2025-05-22	NYS:HRL	1.084683
      2025-05-22	NAS:KDP	1.093528
      2025-05-22	NAS:AAPL 0.968039
      

      Or simply for a single date:

      date = "2020-05-22"
      best_mask = asset_filter.sel(time=date)
      best_assets = best_mask.where(best_mask > 0, drop=True).asset
      best_sr = sharpe_ratio.sel(time=date, asset=best_assets)
      print(best_sr.to_pandas())
      

      This shows clearly that only one asset is selected at each time step, but over the full time range, many different assets can appear in the top list depending on how their Sharpe ratios change.

      posted in Support
      V
      Vyacheslav_B
    • RE: ERROR! The max exposure is too high

      @omohyoid Hello.

      1. Check which dataset you're loading

      You might have loaded stocks_nasdaq100, but are checking it as if it were stocks_s&p500.

      Incorrect:

      import qnt.data as qndata
      import qnt.ta as qnta
      import qnt.stats as qnstats
      import qnt.output as qnout
      import xarray as xr
      
      data = qndata.stocks.load_ndx_data(min_date="2005-06-01")
      qnout.check(weights, data, kind="stocks_s&p500")
      

      Correct:

      data = qndata.stocks.load_spx_data(min_date="2005-06-01")
      qnout.check(weights, data, kind="stocks_s&p500")
      

      ⚠️ kind must match the actual dataset being used, otherwise some checks (e.g., liquidity or available dates) will not behave correctly.


      2. Handling Exposure

      If your exposure does exceed the limit on some days, you can fix it using one of the following methods (see the documentation — Applying Exposure Filters:

      import qnt.output as qnout
      import qnt.exposure as qnexp
      
      weights_1 = qnexp.cut_big_positions(weights=weights, max_weight=0.049)
      weights_2 = qnexp.drop_bad_days(weights=weights, max_weight=0.049)
      weights_3 = qnexp.normalize_by_max_exposure(weights, max_exposure=0.049)
      weights_4 = qnout.clean(weights, data, "stocks_s&p500")
      

      3. Use clean() instead of check() for auto-correction

      If you want the system to automatically fix issues like exposure or normalization, replace check() with clean():

      import qnt.output as qnout
      weights = qnout.clean(weights, data, "stocks_s&p500")
      

      Exposure of 0.0588 is below the hard limit of 0.1, so in this particular case, it does not violate any constraints. The error may have been triggered by other days or higher values elsewhere in the data — it's worth double-checking.

      posted in Support
      V
      Vyacheslav_B
    • RE: toolbox not working in colab

      @alexeigor Hello. Version 0.0.501 of the qnt library works correctly in Colab. Python version support has been extended from 3.10 to 3.13. The basic functionality of the library should work without issues.

      To install, use the following command:

      !pip install git+https://github.com/quantiacs/toolbox.git 2>/dev/null
      

      Note: Installing ta-lib in Colab is not working for me at the moment.

      posted in Support
      V
      Vyacheslav_B
    • RE: AttributeError: module 'qnt.data' has no attribute 'stocks_load_spx_data'

      @nosaai Hi.

      Instructions on how to update the library can be found in the README: https://github.com/quantiacs/toolbox

      Updating the conda environment

      • Regularly update the QNT library for the latest features and fixes:
      ## you can remove the old one before that
          # conda remove -n qntdev quantiacs-source::qnt
      
          conda install -n qntdev quantiacs-source::qnt
      

      Updating the pip environment

      Use this command in your environment to install the latest version from the git repository:

      python -m pip install --upgrade git+https://github.com/quantiacs/toolbox.git
      
      posted in Support
      V
      Vyacheslav_B
    • RE: Q18 Quick start guide not working anymore

      @angusslq Hi. Try cloning the template or restarting JupyterLab. The error was fixed in the new version of the qnt library.

      posted in Support
      V
      Vyacheslav_B
    • RE: Fundamental data loading does not work

      @lookman Hello. Try cloning your strategy and running it again. It should work correctly with the new version of the qnt library.

      import qnt.data as qndata
      import qnt.data.secgov_fundamental as fundamental
      
      market_data = qndata.stocks.load_spx_data(min_date="2005-01-01")
      
      indicators_data = fundamental.load_indicators_for(market_data, indicator_names=['roe'])
      
      display(indicators_data.sel(field="roe").to_pandas().tail(2))
      display(indicators_data.sel(asset='NAS:AAPL').to_pandas().tail(2))
      display(indicators_data.sel(asset=['NAS:AAPL']).sel(field="roe").to_pandas().tail(2))
      

      https://quantiacs.com/documentation/en/data/fundamental.html

      posted in Support
      V
      Vyacheslav_B
    • RE: Struggle creating local dev environment

      @dark-pidgeot Hi! After the release of version qnt “0.0.402” the issue with data loading in the local environment has been resolved. The library now uses newer dependencies, including pandas version 2.2.2.

      posted in Support
      V
      Vyacheslav_B
    • Documentation
    • About
    • Career
    • My account
    • Privacy policy
    • Terms and Conditions
    • Cookies policy
    Home
    Copyright © 2014 - 2021 Quantiacs LLC.
    Powered by NodeBB | Contributors