Calculation of trading strategies
-
-
-
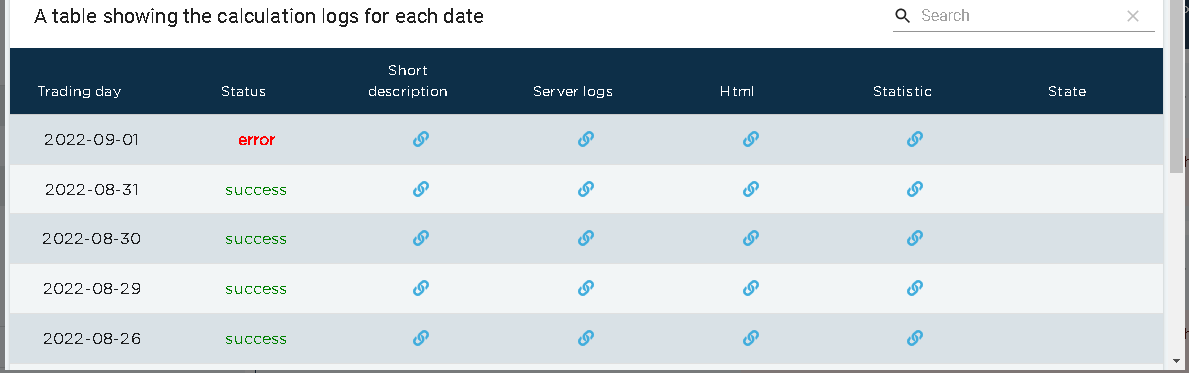
@dark-pidgeot Ok, thanks. If you click on the logs button, there should be info explaining he reason for the failure on Sep 1st. Can you share it?
-
@support Hello, yes I can provide you with the logs without the code.
I am still surprised, I followed the simulation. Everything is going well except for the last day. How is it possible that on the last day, it crashes -
@support Calculation start...
[NbConvertApp] Converting notebook strategy.ipynb to html
[NbConvertApp] Executing notebook with kernel: python3
[NbConvertApp] Writing 699954 bytes to strategy.html
Calculation completed.
Strategy body:In [1]:
%%javascript
window.IPython && (IPython.OutputArea.prototype._should_scroll = function
(lines) { return false; })
// run this cell for disabling widget scrolling
In [2]:
import xarray as xr
import qnt.ta as qnta
import qnt.data as qndata
import qnt.output as qnout
import qnt.stats as qns
from IPython.display import display
import xarray as xr
import qnt.ta as qnta
import qnt.backtester as qnbt
import qnt.data as qndata
data = qndata.stocks.load_ndx_data(min_date="2005-01-01")HIDDEN strategy CODE
SINGLE PASS
is_liquid = data.sel(field="is_liquid")
weights = is_liquid*weightsclean weights taking corner cases into account:
weights = qnout.clean(weights, data, "stocks_nasdaq100")
check before submission:
qnout.check(weights, data, "stocks_nasdaq100")
qnout.write(weights)calc stats
stats = qns.calc_stat(data, weights.sel(time=slice("2000-01-01",None)))
stats.to_pandas().tail()
import qnt.graph as qngraph
import qnt.stats as qnstats
statistics = qnstats.calc_stat(data, weights)
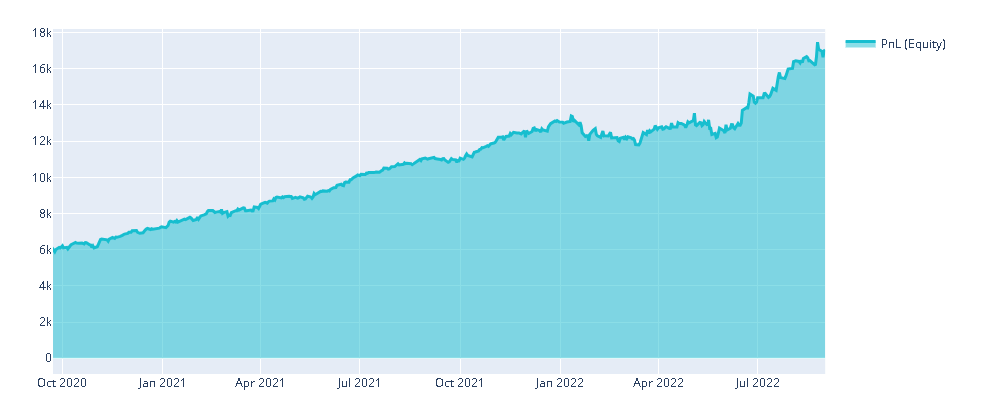
performance = statistics.to_pandas()['equity']
qngraph.make_plot_filled(performance.index, performance, name='PnL (Equity)')qnout.check(weights, data)
100% (35181 of 35181) |##################| Elapsed Time: 0:00:00 Time: 0:00:00
100% (35957 of 35957) |##################| Elapsed Time: 0:00:00 Time: 0:00:00
100% (14750756 of 14750756) |############| Elapsed Time: 0:00:00 Time: 0:00:00
fetched chunk 1/6 1s
100% (14750752 of 14750752) |############| Elapsed Time: 0:00:00 Time: 0:00:00
fetched chunk 2/6 3s
100% (14750720 of 14750720) |############| Elapsed Time: 0:00:00 Time: 0:00:00
fetched chunk 3/6 4s
100% (14750628 of 14750628) |############| Elapsed Time: 0:00:00 Time: 0:00:00
fetched chunk 4/6 6s
100% (14750720 of 14750720) |############| Elapsed Time: 0:00:00 Time: 0:00:00
fetched chunk 5/6 7s
100% (979196 of 979196) |################| Elapsed Time: 0:00:00 Time: 0:00:00
fetched chunk 6/6 7s
Data loaded 8s
Output cleaning...
fix uniq
ffill if the current price is None...
Check liquidity...
Ok.
Check missed dates...
Ok.
Normalization...
Output cleaning is complete.
Check liquidity...
Ok.
Check missed dates...
Ok.
Check the sharpe ratio...
Period: 2006-01-01 - 2022-09-01
Sharpe Ratio =#####
Ok.
Check correlation.
correlation check disabledOk. This strategy does not correlate with other strategies.
Write output: /root/fractions.nc.gz
Check liquidity...
Ok.
Check missed dates...
Ok.
Check the sharpe ratio...
Period: 2006-01-01 - 2022-09-01
Sharpe Ratio = #####
Ok.
Check correlation.
correlation check disabledOk. This strategy does not correlate with other strategies.
In [3]:
performance = statistics.to_pandas()['equity']
qngraph.make_plot_filled(performance.index, performance, name='PnL (Equity)')
Submit...
Post task: https://stat.quantiacs.io/regular/task/343939393231303664343261616232333665666532323034343662653936326535353161353038306566633564333132613465326339326330653931646339363A313636323530313135303A37333730333736/regular/task
{
"submission_id": "7941751",
"output": "H4sIAD3BF2MC/+y9X8xl1ZUnRiZmXBnSEjQVgxCGQUJqWtaIns...",
"source": true,
"html": "H4sIAEbBF2MC/+y9a5PcOK4g+t2/Iscdc9vurkynlG972mdmz2...",
"state": null,
"last_data": true
}
Task #7370376 -
@support The short description :
INFO: 2022-09-06T21:52:30Z: pass started: 7962346
INFO: 2022-09-06T21:53:13Z: pass completed: 7962346
INFO: 2022-09-06T22:49:52Z: stats received light=false
INFO: 2022-09-06T22:49:53Z: progress: 1.0
INFO: 2022-09-06T22:49:53Z: checking: last pass
INFO: 2022-09-06T22:49:53Z: filter passed: source exists
INFO: 2022-09-06T22:49:53Z: filter passed: output html exists
INFO: 2022-09-06T22:49:53Z: filter passed: output exists
INFO: 2022-09-06T22:49:53Z: filter passed: strategy uses the last data
INFO: 2022-09-06T22:49:53Z: filter passed: liquidity
FAIL: 2022-09-06T22:49:53Z: filter failed: in sample period is too short:3417 < 3764 -
@dark-pidgeot ok, there are not enough trading days. Are you generating non-zero positions since 1 Jan 2006?
-
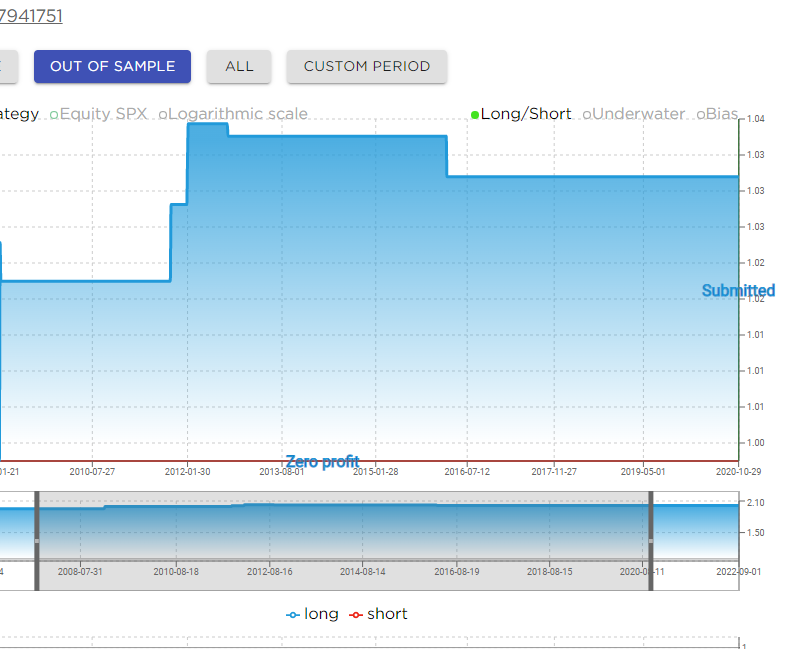
On the picture, there are indeed generated positions, so I don't really understand
-
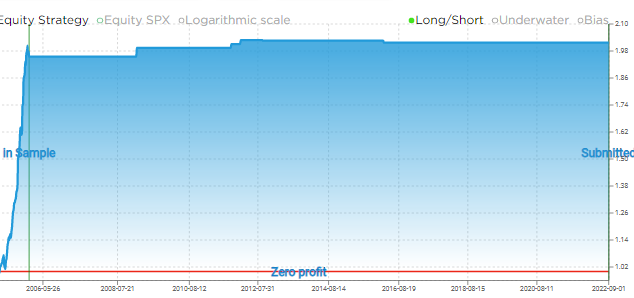
@dark-pidgeot Can you take a screenshot so that it is visible also what happens on 1 Jan 2006? Here it is visible only what happens since 2010.
-
Hi, here the screenshoot
-
@dark-pidgeot Actually there could be some hidden problem.
Your code fails on the very last day, let us say 2022-09-01 as you sent in a previous screenshot.
Are you sure that no forward looking is going on? Let us suppose that we are on 2022-09-01, and on that day your code is looking into the future. Then it will fail, as it will have no data at all.
-
@jeppe_and Thanks for the reply, i'll check my code