Why are my Q17 Strategies not running?
-
@algotime Hello, there was a problem with the ranking on our side. The strategies were processed correctly, the OOS results were fine, but the ranking which appeared on the leaderboard until yesterday was obviously not correct. All strategies are being reprocessed now, they will appear soon in the correct order.
-
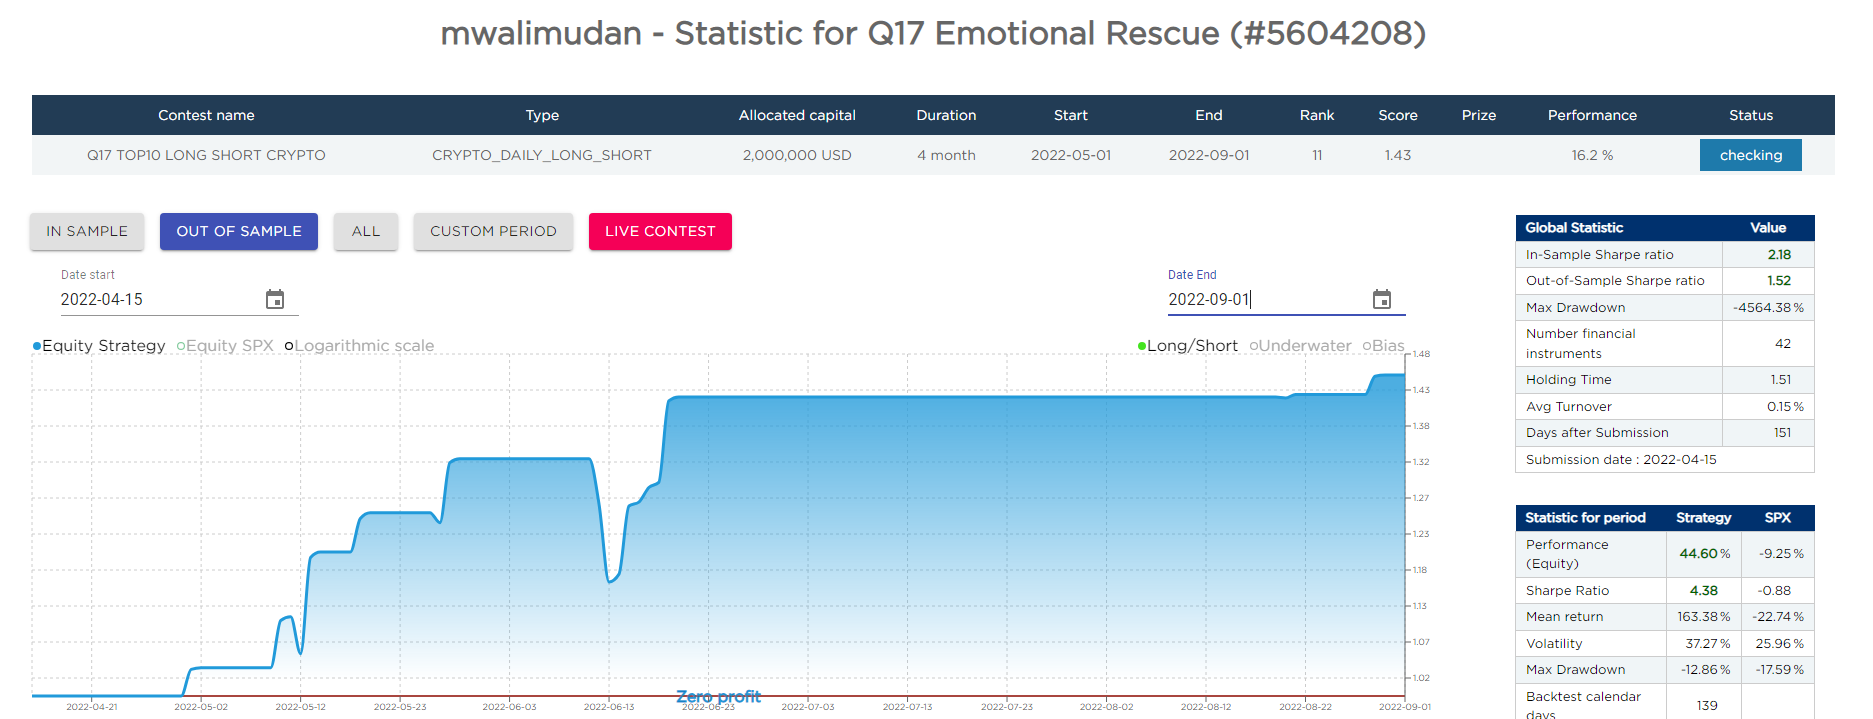
@support , hi, will this scoring update also fix issues like this one where competition Score and Performance don't match Statistics for the contest period?

-
@mwalimudan something looks totally wrong with the plots there, try to select the full period...we will fix it, thanks for pointing it out.
-
@support Thanks!
-
@mwalimudan we are sorry, but the performance of this strategy, as well as another one you submitted, is problematic to evaluate because of numerical instabilities. There can be a discrepancy between the "score" you see on the table (which uses precise routines on the back end) and the Sharpe ratio you see on the page, as it changes dynamically when you select the custom period. We cannot use the more precise routines for displaying the results, it would take too much time.
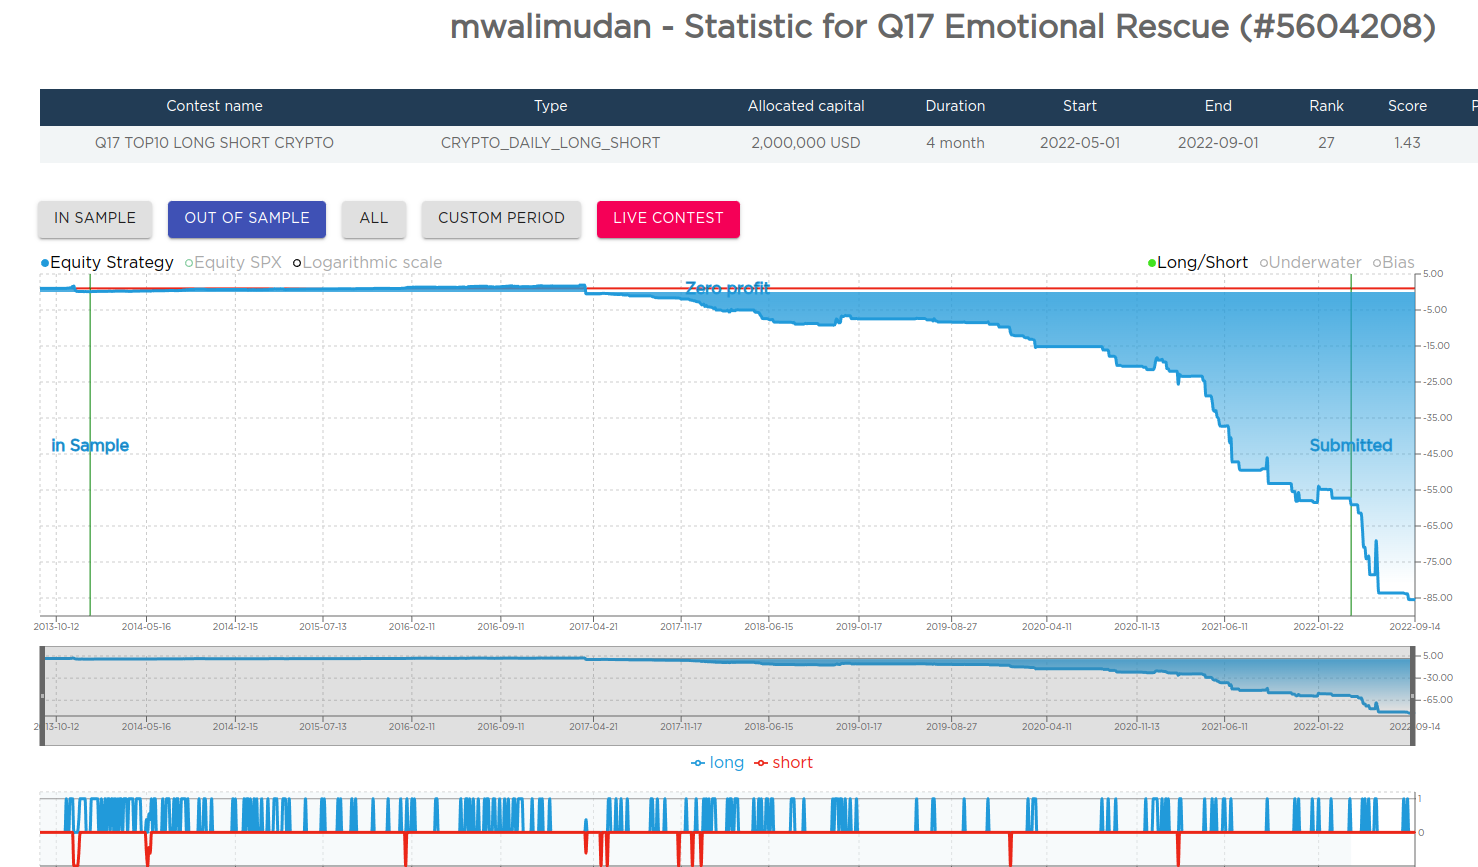
Indeed since 2017-04-01 the positions lead to a negative equity curve, which clearly makes no sense.
Do you have some hint for us?
-
@support Thanks for the update. I'm not sure what you mean by a hint. The strategy is a pretty simple mean reversion idea. I rely on your routines to guide me as to when a strategy has a good enough OOS SR to enter competitions.
-
Hello, as you can see the full plot of the equity chart makes no sense. The equity is positive till something like 2017-04-01, then it goes broke. For some reason we do not get yet (probably a numerical instability, as "0" in double precision is not really "0" so we need to use tolerance levels in the code), instead of "going broke" the strategy is still traded and generates a negative equity chart.
Do you see the same behaviour when you run a notebook? Same plot?
-
@mwalimudan Hello, we checked the positions day by day.
On April 1st system had an exposure of:
47.62% to DASH (long)
-52.38% to XRP (short)at the close. These positions have to be multiplied by the relative open-to-open returns between April 2nd and April 3rd, where we see from data:
DASH -> -16.72%;
XRP -> +179.55%;The combined losses are larger than 100% in a single day, so the system went broken in a single day.
Our backtester did not handle well the event and, instead of stopping trading, generated a meaningless negative equity chart. But later results make no sense as inputs are negative values....
-
@support Thanks for the explanation, which makes sense. So, I assume that the system should not have been accepted at all and something needs to change at your end to prevent this happening?
-
@mwalimudan Yes, we are really sorry. We did not think about these corner cases, but with cryptos, they can take place.
