Different Sharpe ratios in backtest and competition filter
-
When I run my futures strategy in a notebook on the server starting 2006-01-01 I get this result:
Check the sharpe ratio...
Period: 2006-01-01 - 2021-03-01
Sharpe Ratio = 1.3020322470218595However, it gets rejected from the competition because the Sharpe is below 1. When I click on its chart in the "Filtered" tab it shows
Sharpe Ratio 0.85
When I copy the code from the html-previev of the rejected algo and paste it into a notebook, I get exactly the same result as above (Sharpe 1.3), so it doesn't seem to be a saving error.
Why is there such a big difference? I thought the backtest results from the notebook shuld indicate if the strategy is elegible for the competition.
How can I calculate the Sharpe ratio used for the competition in the notebook so I will know beforehand if the algo gets accepted or not? -
@antinomy Hello, sorry for delay, we coded some mock examples to reconstruct potential problems. There are at least 2 options:
- Single-pass vs multi-pass evaluation. There are 2 ways to code a system on Quantiacs, processing all time series in one shot (single-pass evaluation) or step-by-step using a multi-pass evaluation.
Single-pass evaluation occurs when the complete time series is accessed at once. In this case, it can happen that the last points of the time series are used to take a decision at a former time. For example, the code could use the global mean of some variable as a reference value for all the time series.
Multi-pass evaluation can be performed using the built-in backtesting function. In this way no forward looking can take place as at time "t" (open) only data until time "t-1" (close) are available.
Both options are allowed in the Development area (notebooks). Once the code is submitted, it is processed only with our multi-pass backtester on the server.
Therefore, a looking-forward single-pass submission could have a large Sharpe ratio when processed on the notebook, and a small one on the server, and be rejected.
- The second reason is more subtle, and it is connected to the fact that the Quantiacs backtester does not save the state of variables between passes. Variable values are not stored but they are recomputed at every step.
As a consequence, if you use for example global variables and update state between passes, the result on the notebook will be fine, but the one on the server will not recognize the variable update.
-
@antinomy We decided to open an issue on point 2) as we never mentioned this point in the documentation: https://quantiacs.com/community/topic/15/share-the-state-between-iterations?_=1614767260575
-
Thank you for the answer!
if you use for example global variables and update state between passes
Yep, that's exactly what I did.
-
I managed to implement it without global variables, now the sharpe ratio matches and it got accepted.
Thanks again! -
@antinomy Ok, that's great. But we put in our roadmap the option to update state between passes also.
-
Hi mates!
I have a question about the sharpe ratio shown in the global leaderboard...
If we take the value indicated in the main interface for the out of sample, and then try to replicate it by accessing a specific system and filtering its OOS period, the value obtained differs from the one shown In the main interface of the global leaderboard.Why is this discrepancy generated? And which of the two sharpe ratio values is correct?
Thanks in advance!
-
@captain-nidoran Hi, first of all, two considerations:
-
for systems with a very short track record (some days) there are numerical instabilities in the computation (especially for BTC Futures systems) because of the strong fluctuations in the equity curves.
-
the result indicated in the main interface is obtained using the evaluator which runs on the Quantiacs server. The result is then pushed to the front end. If instead you access a specific system and you filter the OOS period using the graphical interface, then the computation will use a quick front-end script for making computations. So numerical discrepancies can arise, but they should become smaller as the OOS period becomes larger (see also point 1).
The result indicated in the main interface is more precise.
However, could you show one example showing the discrepancy? So we will dig more into the issue, and see if there is only a numerical issue or a bug which has to be fixed.
-
-
@support Hi again,
As an example, lets consider this one:

As you can see the SR shown for OOS in the global leaderboard is 2.044, but if we acces this specific system and filter the OOS period we can see this:
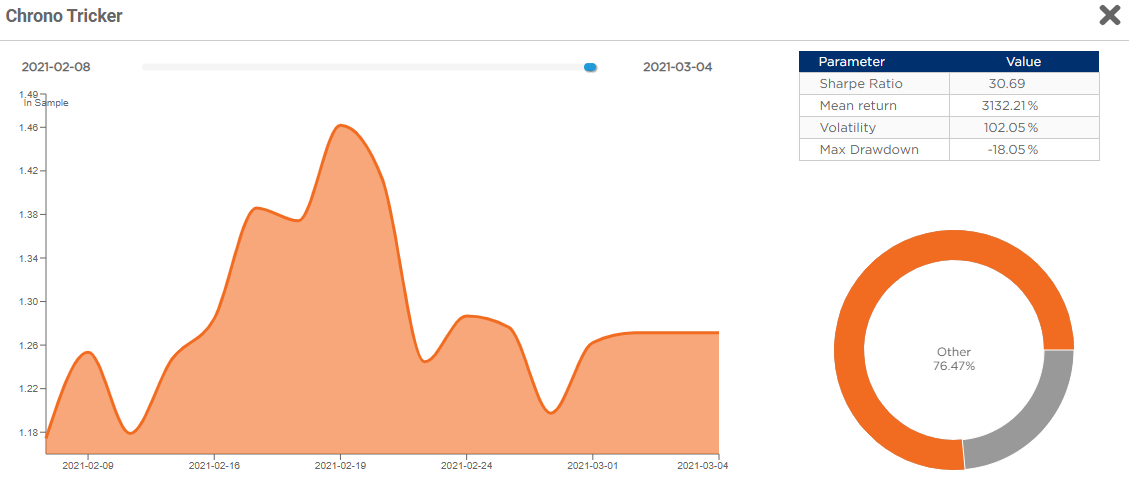
In this case the SR shown inside the specific system is 30.69I hope this example can help you.
Thanks one more time!
")
-
@captain-nidoran Ok, so we tracked the issue, sorry for the delay. The chart uses the fast calculation of the Shape Ratio based on precalculated relative returns, which are cropped:
chart_sr = calc_sharpe_ratio(crop(relative_returns))
But the rating page calculates it in another way. It crops the output (equity chart), it calculates the relative returns, and then it calculates the Sharpe Ratio.
chart_sr = calc_sharpe_ratio(calc_relative_returns(crop(output)))
The starting point of the computations (first relative return) is different and it includes a big leap of 18% on day 1.
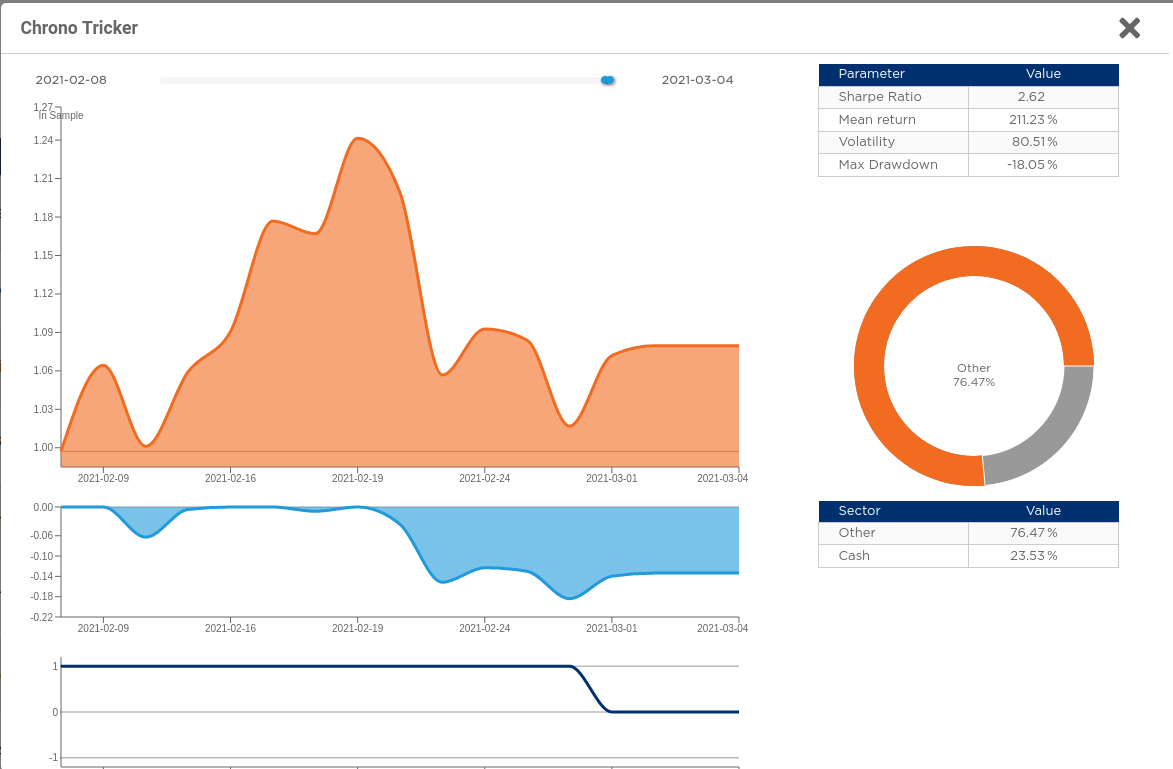
We modified the results displayed in the charts so that the y axis is rescaled, and the very first point has "zero" returns.
Now it became as follows (note that y axis started at 1.18, now it starts at 1):
-
@captain-nidoran The remaining difference you see not is due to the different approximated implementation on the front-end, for the contest the relevant result is the one displayed on the OOS column. As time increases, this difference will vanish.
-
@support Thank you very much for the clarification, and once again congratulations for the great job you are doing