Navigation

    Quantiacs Community

    • Register
    • Login
    • Search
    • Categories
    • News
    • Recent
    • Tags
    • Popular
    • Users
    • Groups
    1. Home
    2. kairos
    K
    • Profile
    • Following 0
    • Followers 0
    • Topics 1
    • Posts 1
    • Best 0
    • Groups 0
    • Blog

    kairos

    @kairos

    0
    Reputation
    7
    Profile views
    1
    Posts
    0
    Followers
    0
    Following
    Joined Last Online

    kairos Follow

    Latest posts made by kairos

    • Nan rows observed in is_liquid data

      Hi,

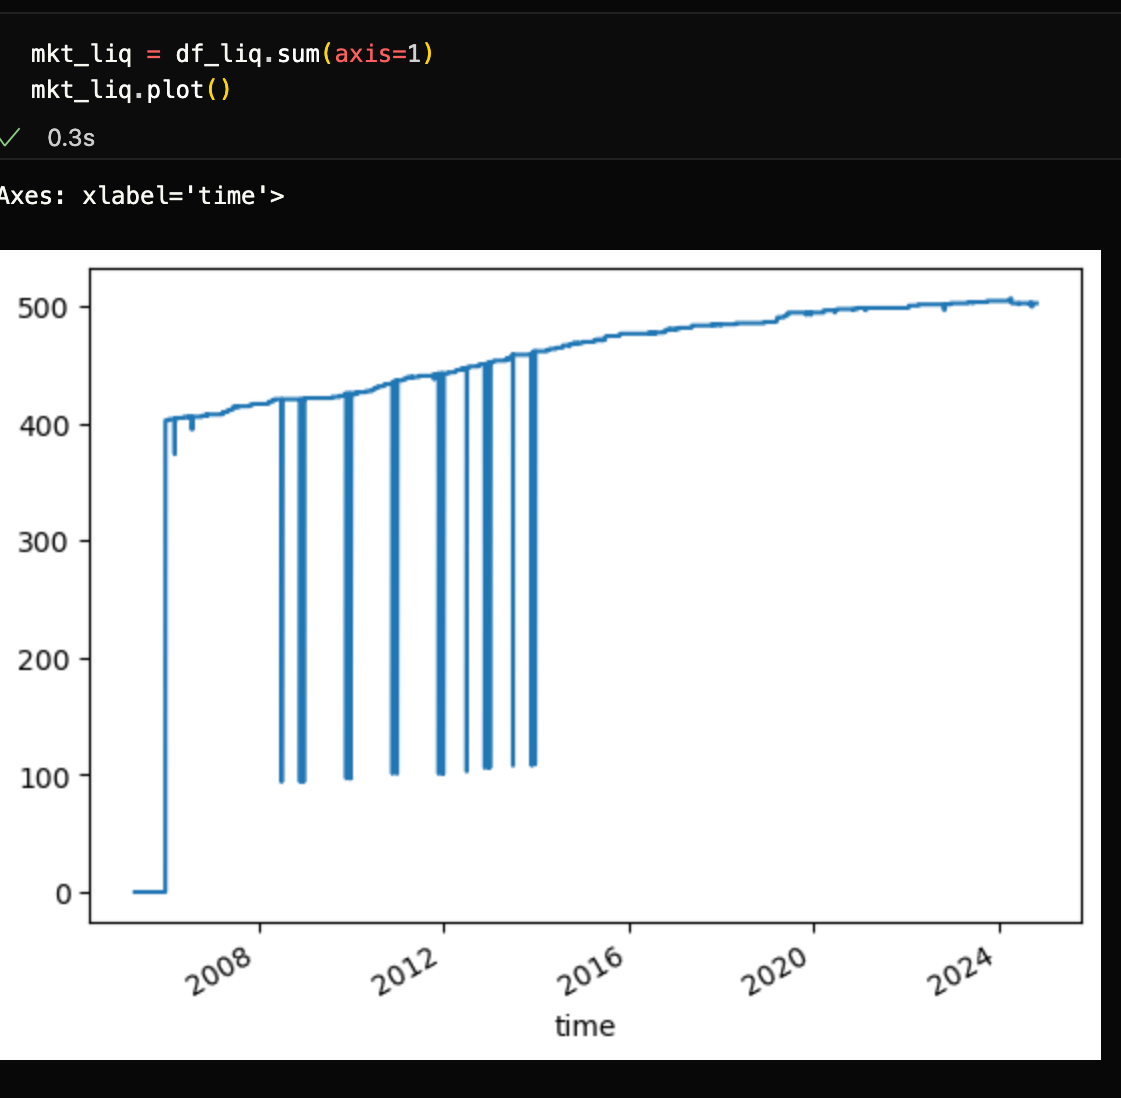
      I'm working on S&P500 competitions and I found something strange in is_liquid field. As you see the 1st plot below, I counted the number of liquid stocks from June 2005 to now. I observed is_liquid row is all NaN for dates before January 1st 2006 and that is ok.

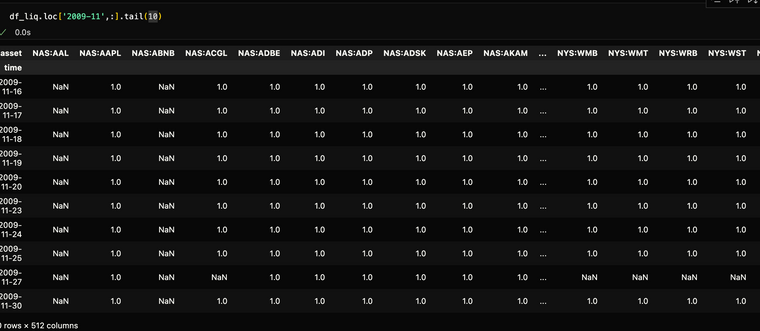
      But the problem is with the dates where the number of liquid stocks suddenly drops to 100 and gets back to 400-500 the day after - what's the reason for this? In the 2nd picture, you can see that at 2009/11/27, some assets have NaN for is_liquid filed and gets back to 1 after.

      Given the raw data is like this, I'm not sure the cleaning function qnout.clean() appropriately handles liquidity filter error. Can you give me a clarification?

      liq_all.png is_liquid.png

      posted in Support
      K
      kairos
    • Documentation
    • About
    • Career
    • My account
    • Privacy policy
    • Terms and Conditions
    • Cookies policy
    Home
    Copyright © 2014 - 2021 Quantiacs LLC.
    Powered by NodeBB | Contributors