Optimizing and Monitoring a Trading System with Quantiacs
-
*This article was published on Medium: check it out here.
In this article we describe the implementation of a new tool we released for the Quantiacs Python toolbox: a fast optimizer for testing the robustness of a trading system.*
As Donald Knuth pointed out, “Premature optimization is the root of all evil.” This is a famous saying among software developers and it is true also in the context of trading system development.

Photo by Jefferson Santos on UnsplashIt is very tempting to write an algorithm, a simple trend-following strategy or a more refined machine-learning based system, and then to search for optimal parameters or hyperparameters which are going to maximize a given score function, normally the Sharpe ratio.
As optimal parameters are maximizing the chosen score function in the past, and financial data are very noisy, the usual result of parameter optimization is overfitting: the trading system works so well with past data that it becomes useless for predicting future market moves.
The problem of inflating the simulated performance of a trading system extends beyond backtest optimizers: for example, developers tend to focus and report only on positive outcomes out of all the models they try, an issue known as selection bias. For a detailed description of these problems we refer to the 2014 article by Marcos Lopez de Prado.
Nevertheless, optimizers rely on a basic functionality which can be used for testing the robustness of a trading system: a grid scan of the system over possible combinations of the parameters. The results of the scan can be used to visualize and test how much the performance of the trading system is sensitive to the parameter choice. A robust system will have a good Sharpe ratio for a wide range of the independent parameters.
Trading System Optimization with Quantiacs
You can find our optimizer in the Examples section of the Development area of your account:
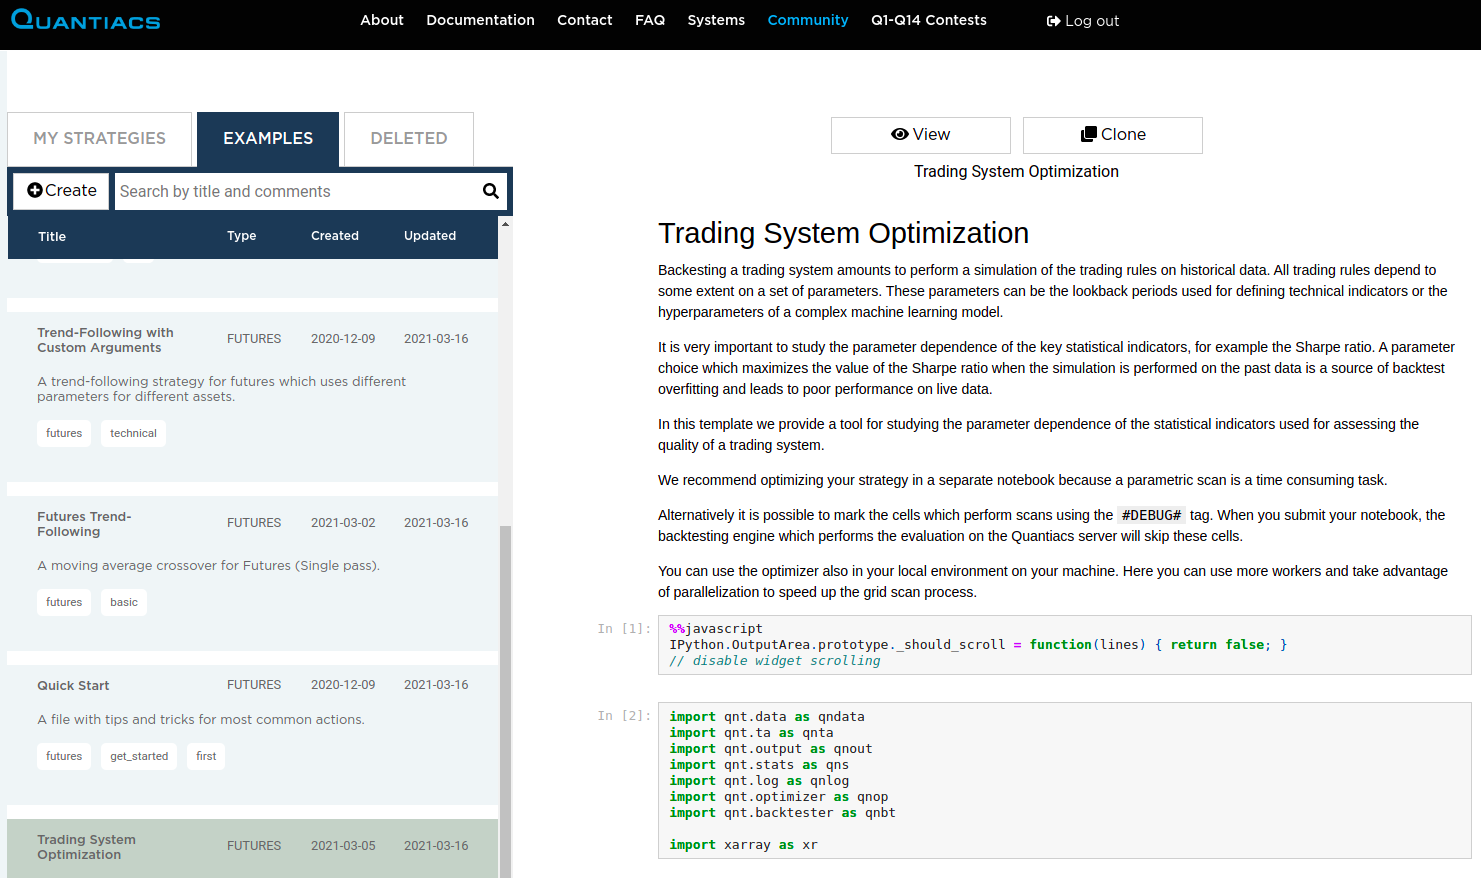
For running the example, simply click on the Clone button and work in your favourite environment, Jupyter Notebook or JupyterLab. Alternatively you can download locally the Quantiacs toolbox and take advantage of parallelization on your own machine.
Let us analyze the code. First of all we import the needed libraries:
import qnt.data as qndata
import qnt.ta as qnta
import qnt.output as qnout
import qnt.stats as qns
import qnt.log as qnlog
import qnt.optimizer as qnop
import qnt.backtester as qnbt

import xarray as xr
In addition to the Quantiacs library, freely available at our GitHub page, we import xarray for quick processing of multi-dimensional data structures.
Next we define a simple trading rule based on two parameters. The strategy is going long only when the rate of change in the last "roc_period" trading days (in this case 10) of the linear-weighted moving average over the last "wma_period" trading days (in this case 20) is positive:
def single_pass_strategy(data, wma_period=20, roc_period=10):
    wma = qnta.lwma(data.sel(field='close'), wma_period)
    sroc = qnta.roc(wma, roc_period)
    weights = xr.where(sroc > 0, 1, 0)
    weights = weights / len(data.asset)
    with qnlog.Settings(info=False, err=False):
        weights = qnout.clean(weights, data, debug=False)
    return weights
The strategy returns allocation weights (fraction of capital to be invested) for every day. We check the performance of this strategy with the chosen parameters:
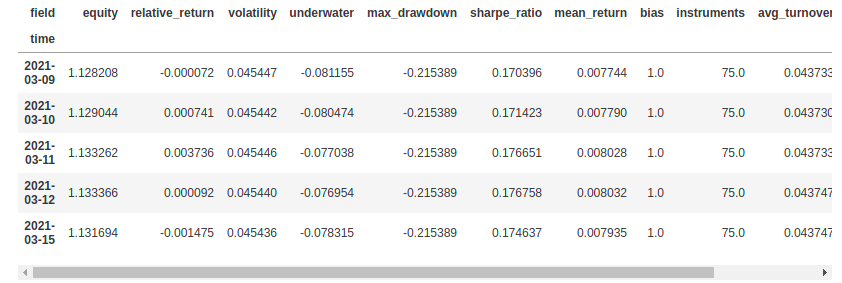
data = qndata.futures.load_data(min_date='2004-01-01')
single_pass_output = single_pass_strategy(data)
single_pass_stat = qns.calc_stat(data,\
    single_pass_output.sel(time=slice('2006-01-01', None)))
display(single_pass_stat.to_pandas().tail())
The code returns the values of the relevant statistical indicators, including the Sharpe ratio, in a table, since beginning of the in-sample period:
Next we run the optimization code, which performs a scan over a predefined range of parameter values: the user can choose for each parameter the starting value, the final one and the step:
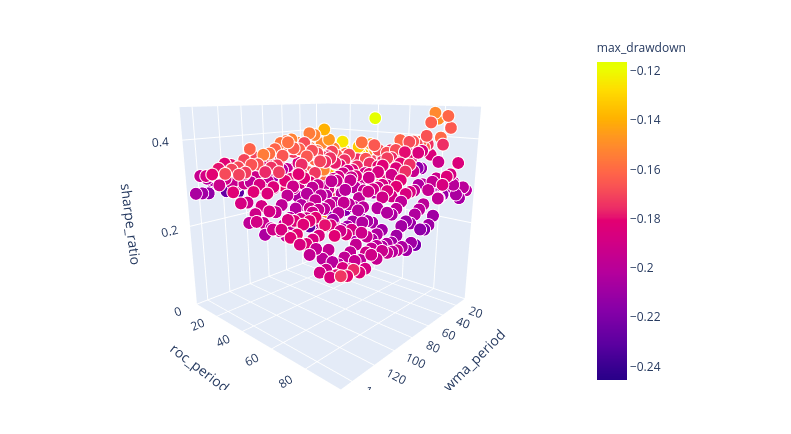
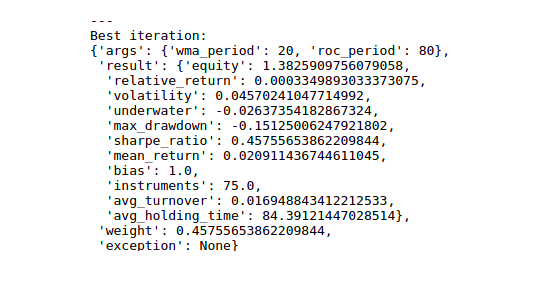
data = qndata.futures.load_data(min_date='2004-01-01')

result = qnop.optimize_strategy(
    data,
    single_pass_strategy,
    qnop.full_range_args_generator(
        wma_period=range(10, 150, 5), # min, max, step
        roc_period=range(5, 100, 5)   # min, max, step
    ),
    workers=1 # you can set more workers on your PC
)

qnop.build_plot(result)

print("---")
print("Best iteration:")
display(result['best_iteration'])
The code returns an interactive plot where one can analyze the dependence of the key statistical indicators on the parameters. In this plot we display the two independent parameters on the x and y axis, the Sharpe ratio value on he z axis and use different colors according to the maximum drawdown.
As a reference, we display the optimal values of the parameters which maximize the Sharpe ratio (beware of overfitting!):
A robust trading system will have a smooth dependence of the Sharpe ratio on the parameter values, ideally with good values larger than 1 for a wide choice of the parameters. An overfitted system will display typically a Sharpe ratio peak for a particular choice of the independent parameters.
Do you have questions or suggestions? Post them in our Forum or write us to info@quantiacs.com!
You can try the optimizer on Quantiacs. The code can be found in the Examples section of the Development area of your account. Or you can download the full code from our GitHub repository.