Thank you very much, this is awesome!
And I also congratulate the other 2 winners!
I got notified by e-mail 2 days ago and have been totally excited since then 
A
Best posts made by antinomy
-
RE: Announcing the Winners of the Q14 Contestposted in News and Feature Releases
-
External Librariesposted in Support
Hello @support ,
I've been using cvxpy in the server environment which I installed by running
!conda install -y -c conda-forge cvxpyin init.ipynb. But whenever this environment is newly initialized, the module is gone and I have to run this cell again (which takes awfully long).
Is this normal or is there something wrong with my environment?
My current workaround is placing these lines before the importtry: import cvxpy as cp except ImportError: import subprocess cmd = 'conda install -y -c conda-forge cvxpy'.split() rn = subprocess.run(cmd) import cvxpy as cpIs there a better way?
Best regards.
-
RE: Bollinger Bandsposted in Strategy help
@anthony_m
Bollinger Bands are actually quite easy to calculate.
The middle band is just the simple moving average, the default period is 20.
For the other bands you need the standard deviation for the same period.
The upper band is middle + multiplier * std
The lower band is middle - multiplier * std
Where the default for the multiplier is 2.There's an article on the formula for Bollinger Bands on Investopedia - they use the 'typical price' (high + low + close) / 3 but I think most people just use the close price.
For the code it depends if you only need the latest values or the history.
Using pandas the code for the first alternative could be:def strategy(data): close = data.sel(field='close').copy().to_pandas().ffill().bfill().fillna(0) # let's just use the default 20 period: period = 20 sma = close.iloc[-period:].mean() std = close.iloc[-period:].std() # and the default multiplier of 2: multiplier = 2 upper = sma + multiplier * std lower = sma - multiplier * stdIf you need more than the last values you can use pandas.rolling:
def strategy(data): close = data.sel(field='close').copy().to_pandas().ffill().bfill().fillna(0) # let's just use the default 20 period: period = 20 sma = close.rolling(period).mean() std = close.rolling(period).std() # and the default multiplier of 2: multiplier = 2 upper = sma + multiplier * std lower = sma - multiplier * std -
Different Sharpe ratios in backtest and competition filterposted in Support
When I run my futures strategy in a notebook on the server starting 2006-01-01 I get this result:
Check the sharpe ratio...
Period: 2006-01-01 - 2021-03-01
Sharpe Ratio = 1.3020322470218595However, it gets rejected from the competition because the Sharpe is below 1. When I click on its chart in the "Filtered" tab it shows
Sharpe Ratio 0.85
When I copy the code from the html-previev of the rejected algo and paste it into a notebook, I get exactly the same result as above (Sharpe 1.3), so it doesn't seem to be a saving error.
Why is there such a big difference? I thought the backtest results from the notebook shuld indicate if the strategy is elegible for the competition.
How can I calculate the Sharpe ratio used for the competition in the notebook so I will know beforehand if the algo gets accepted or not? -
RE: The Q16 Contest is open!posted in News and Feature Releases
@support
First of all, having looked at various sources for crypto data myself, I know this can be a pain in the neck, so I can appreciate the effort you took to provide it.I get the method for avoiding lookahead-bias by including delisted symbols. The key point would be what you mean exactly by disappeared and from where.
Do you mean they were delisted from the exchange where the winning algos will be traded or did the data source you used just not have data?To name 2 examples: DASH and XMR don't have recent prices but I don't know of an exchange they were delisted from. When I look them up on tradingview they do have prices on all the exchanges available there and are still traded with normal volumes.
Charts for their closing price on quantiacs:
import qnt.data as qndata

data = qndata.cryptodaily_load_data(min_date='2020')
close = data.sel(field='close').to_pandas()
close[['DASH', 'XMR']].plot()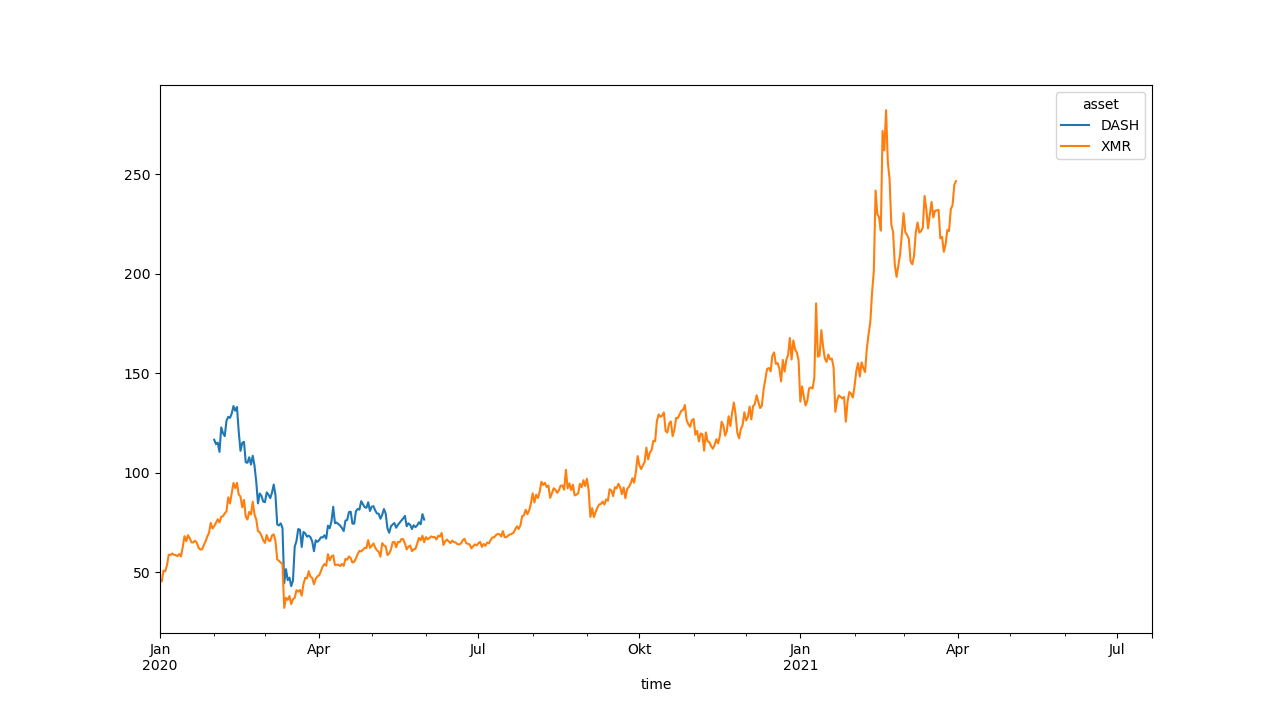
On tradingview:
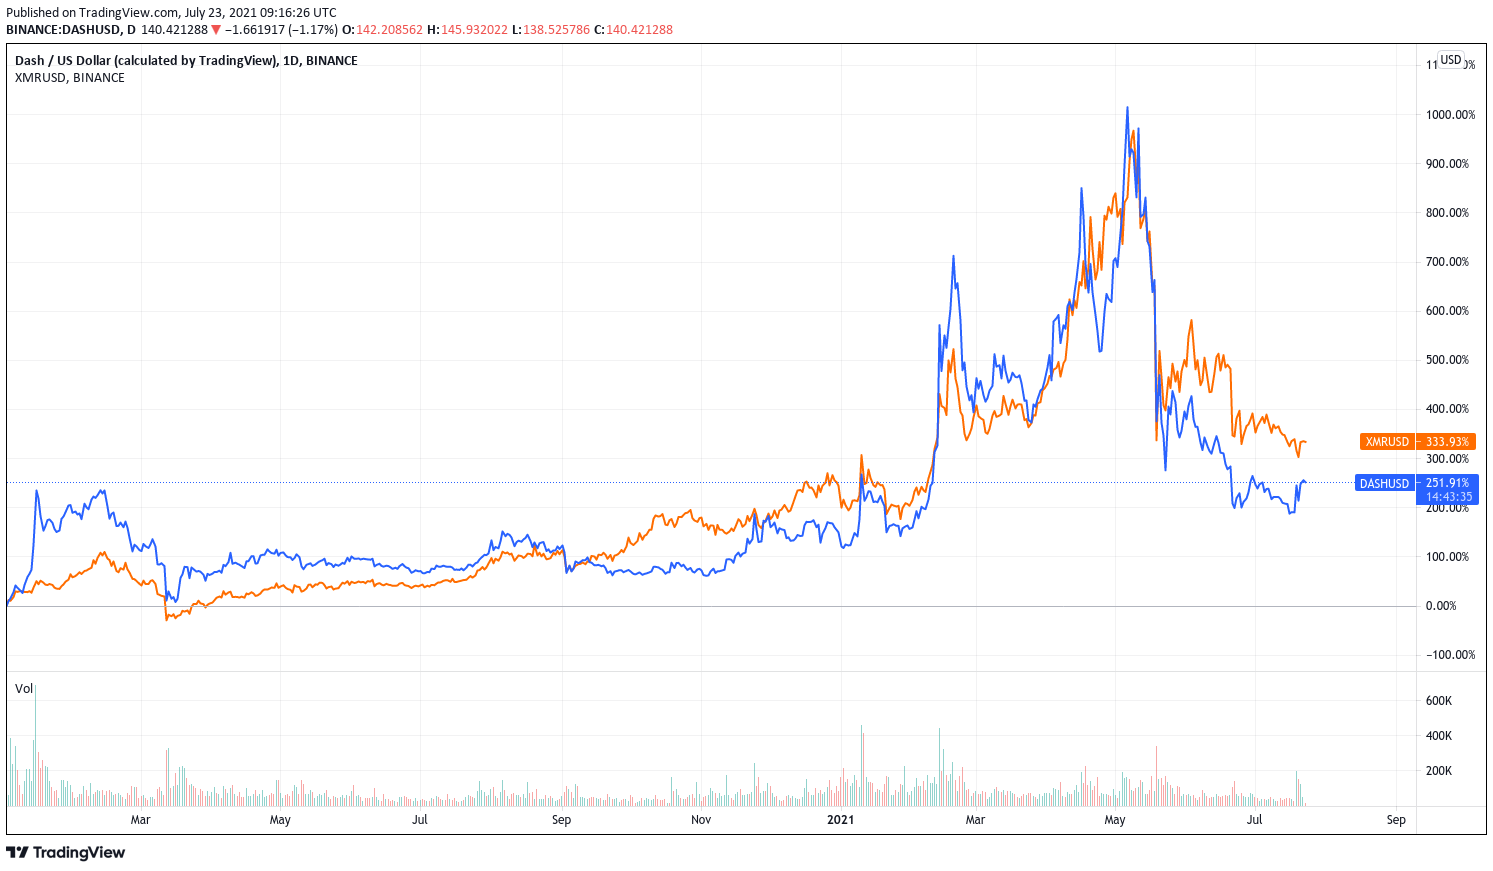
There are many reasons why we might need prices for symbols that are currently not among the top 10 in terms of market cap. An obvious one would be that they might be included in the filter again any second and algorithms do need historical data. Also, there are many ways to include symbols in computations without trading them: as indicators, to calculate market averages and so on.
-
RE: The Q16 Contest is open!posted in News and Feature Releases
@support
I totally agree that the indicator usage is not trivial at all regarding lookahead-bias, still trying to wrap my head around it
The symbol list alone could already lead to lookahead bias - in theory, I don't have a realistic example.
Because if the symbol is in the dataset, the algo could know it will be among the top 10 at some point, thus probably go up in price.
I guess we really need to be extra careful avoiding these pitfalls, but they might also become apparent after the submission...From what I understand this contest is kind of a trial run for the stocks contest, so may I make a suggestion?
On Quantopian there was data for around 8000 assets, including non-stocks like ETFs but for the daily contest for instance, the symbols had to be in the subset of liquid stocks they defined (around 2000 I think).The scenarios
- there's a price for that stock, it will become large
- it's included in the asset list, it must go up some day
were not really a problem because there was no way to infer from prices or the symbol being present that it will be included in the filter some day.
Maybe you could do something like that, too?
It doesn't have to be those kind of numbers, but simply providing data for a larger set of assets containing symbols which will never be included in the filter could avoid this problem (plus of course including delisted stocks).For this contest I think your suggestion to retroactively fill the data if a symbol makes it on top again is a good idea.
-
RE: The Q16 Contest is open!posted in News and Feature Releases
@support In my posts I was merely thinking about unintentional lookahead bias because when it comes to the intentional kind, there are lots of ways to do that and I believe you never can make all of them impossible.
But I think that's what the rules are for and the live test is also a good measure to call out intentional or unintentional lookahead bias as well as simple innocent overfitting.To clarify the Quantopian example a bit, I don't think what I described was meant to prevent lookahead bias. The 8000 something symbols just was all what they had and the rules for the tradable universe were publicly available (QTradableStocksUS on archive.org). I just thought, providing data for a larger set than what's actually tradable would make the scenarios I mentioned less likely. For that purpose I think both sets could also be openly defined. Let's say the larger one has the top 100 symbols in terms of market cap, dollar volume or whatever and the tradable ones could be the top 10 out of them with the same measurement.
On the other hand, I still don't know if those scenarios could become a real problem. Because what good does this foreknowledge if you can't trade them yet? And after they're in the top 10 it would be legitimate to use the fact that they just entered, because we would also have known this at that time in real life.
-
RE: The Quantiacs Referral Programposted in News and Feature Releases
@news-quantiacs
Hello,
about that link, the important part is the one that starts with the question mark, with utm_medium being our unique identifier, right?
So, can we change the link to point to the contest description instead of the login-page, like this?
https://quantiacs.com/contest?utm_source=reference&utm_medium=19014
Then interested people could first read more details about the contest before signing up... -
RE: How to fix this errorposted in Support
Asuming whatever train is has a similar structure as the usual stock data, I get the same error as you with:
import itertools
import qnt.data as qndata

stocks = qndata.stocks_load_ndx_data(tail=100)

for comb in itertools.combinations(stocks.asset, 2):
    print(stocks.sel(asset=[comb]))
There are 2 things to consider:
- comb is a tuple and you can't use tuples as value for the asset argument. You are putting brackets around it, but that gives you a list with one element wich is a tuple, hence the error about setting an array element as a sequence. Using stocks.sel(asset=list(comb)) instead resolves this issue but then you'll get an index error which leads to the second point
- each element in comb is a DataArray and cannot be used as an index element to select from the data. You want the string values instead, for this you can iterate over asset.values for instance.
My example works when the loop looks like this:
for comb in itertools.combinations(stocks.asset.values, 2): print(stocks.sel(asset=list(comb))) -
RE: Why .interpolate_na dosen't work well ?posted in Support
@cyan-gloom
interpolate_na() only eliminates NaNs between 2 valid data points. Take a look at this example:import qnt.data as qndata import numpy as np stocks = qndata.stocks_load_ndx_data() sample = stocks[:, -5:, -6:] # The latest 5 dates for the last 6 assets print(sample.sel(field='close').to_pandas()) """ asset NYS:NCLH NYS:ORCL NYS:PRGO NYS:QGEN NYS:RHT NYS:TEVA time 2023-05-12 13.24 97.85 35.21 45.09 NaN 8.03 2023-05-15 13.71 97.26 34.23 45.36 NaN 8.07 2023-05-16 13.48 98.25 32.84 45.25 NaN 8.13 2023-05-17 14.35 99.77 32.86 44.95 NaN 8.13 2023-05-18 14.53 102.34 33.43 44.92 NaN 8.26 """ # Let's add some more NaN values: sample.values[3, (1,3), 0] = np.nan sample.values[3, 1:4, 1] = np.nan sample.values[3, :2, 2] = np.nan sample.values[3, 2:, 3] = np.nan sample.values[3, :-1, 5] = np.nan print(sample.sel(field='close').to_pandas()) """ asset NYS:NCLH NYS:ORCL NYS:PRGO NYS:QGEN NYS:RHT NYS:TEVA time 2023-05-12 13.24 97.85 NaN 45.09 NaN NaN 2023-05-15 NaN NaN NaN 45.36 NaN NaN 2023-05-16 13.48 NaN 32.84 NaN NaN NaN 2023-05-17 NaN NaN 32.86 NaN NaN NaN 2023-05-18 14.53 102.34 33.43 NaN NaN 8.26 """ # Interpolate the NaN values: print(sample.interpolate_na('time').sel(field='close').to_pandas()) """ asset NYS:NCLH NYS:ORCL NYS:PRGO NYS:QGEN NYS:RHT NYS:TEVA time 2023-05-12 13.240 97.850000 NaN 45.09 NaN NaN 2023-05-15 13.420 100.095000 NaN 45.36 NaN NaN 2023-05-16 13.480 100.843333 32.84 NaN NaN NaN 2023-05-17 14.005 101.591667 32.86 NaN NaN NaN 2023-05-18 14.530 102.340000 33.43 NaN NaN 8.26 """As you can see, only the NaNs in the first 2 columns are being replaced. The others remain untouched and might be dropped when you use dropna().
Another thing you should keep in mind is that you might introduce lookahead bias with interpoloation, e. g. in a single run backtest. In my example for instance (pretend the NaNs I added were already in the data) you would know on 2023-05-15 that ORCL will rise when in reality you would first know that on 2023-05-18.
-
RE: toolbox not working in colabposted in Support
I got the same error after installing
qntlocally with pip.
There is indeed a circular import in the current Github repo for the toolbox, introduced by this commit:
https://github.com/quantiacs/toolbox/commit/78beafa93775f33606156169b3e6b8f995804151#diff-89350fe373763b439e4697f9b11cceb811b4a3f0adc7a655707a936ce5646c01R6-R10
when some of the imports inoutput.pywhich were inside of fuctions before were moved to the top level.
Nowoutputimports fromstatsandstatsimports fromoutput.@support Can you please have a look?
@alexeigor @omohyoid
The conda version ofqntdoesn't seem to be affected, so if that's an option for you install that one instead.
Otherwise we can use the git version previous to the commit above:pip uninstall qnt pip install git+https://github.com/quantiacs/toolbox.git@a1e6351446cd936532af185fb519ef92f5b1ac6d -
RE: Some top S&P 500 companies are not available?posted in Support
The symbols are all in there, but if they are listed on NYSE you have to prepend
NYS:notNAS:to the symbol. Also, I believe by 'BKR.B' you mean 'BRK.B'[sym for sym in data.asset.values if any(map(lambda x: x in sym, ['JPM', 'LLY', 'BRK.B']))]['NYS:BRK.B', 'NYS:JPM', 'NYS:LLY']You can also search for symbols in
qndata.stocks_load_spx_list()and get a little more infos like this:syms = qndata.stocks_load_spx_list() [sym for sym in syms if sym['symbol'] in ['JPM', 'LLY', 'BRK.B']][{'name': 'Berkshire Hathaway Inc', 'sector': 'Finance', 'symbol': 'BRK.B', 'exchange': 'NYS', 'id': 'NYS:BRK.B', 'cik': '1067983', 'FIGI': 'tts-824192'}, {'name': 'JP Morgan Chase and Co', 'sector': 'Finance', 'symbol': 'JPM', 'exchange': 'NYS', 'id': 'NYS:JPM', 'cik': '19617', 'FIGI': 'tts-825840'}, {'name': 'Eli Lilly and Co', 'sector': 'Healthcare', 'symbol': 'LLY', 'exchange': 'NYS', 'id': 'NYS:LLY', 'cik': '59478', 'FIGI': 'tts-820450'}]The value for the key 'id' is what you will find in
data.asset -
RE: ERROR! The max exposure is too highposted in Support
@support,
Either something about the exposure calculation is wrong or I really need clarification on the rules. About the position limit I only find rule 7. o. in the contest rules which states "The evaluation system limits the maximum position size for a single financial instrument to 10%"I always assumed this would mean the maximum weight for an asset would be 0.1 meaning 10 % of the portfolio. However the exposure calculation suggests the following:
Either we trade no asset or at least 10 assets per trading day, regardless of the actual weights assigned to each asset.Consider this example:
import qnt.data as qndata
import qnt.output as qnout
from qnt.filter import filter_sharpe_ratio


data = qndata.stocks.load_spx_data(min_date="2005-01-01")

weights = data.sel(field='is_liquid').fillna(0)
weights *= filter_sharpe_ratio(data, weights, 3) * .01 # assign 1 % to each asset using the top 3 assets by sharpe

qnout.check(weights, data, "stocks_s&p500")
which results in an exposure error:
Check max exposure for index stocks (nasdaq100, s&p500)…
ERROR! The max exposure is too high.
Max exposure: [0.         0.         0.         ... 0.33333333 0.33333333 0.33333333] Hard limit: 0.1
Use qnt.output.cut_big_positions() or normalize_by_max_exposure() to fix.
even though the maximum weight per asset is only 0.01
abs(weights).values.max()
0.01
(By the way, the 4 functions mentioned by @Vyacheslav_B also result in weights which dont't pass the exposure check when used with this example, except
drop_bad_dayswhich results in empty weights.)And if we assign 100 % to every liquid asset, the exposure check passes:
weights = data.sel(field='is_liquid').fillna(0)
qnout.check(weights, data, "stocks_s&p500")
Check max exposure for index stocks (nasdaq100, s&p500)… Ok.So, does rule 7. o. mean we have to trade at least 10 assets or none at all each trading day to satisfy the exposure check?
-
RE: ERROR! The max exposure is too highposted in Support
@vyacheslav_b Hi, I agree that diversification is always a good idea for trading. It might be helpful if there was an additional function like
check_diversificationwhith a parameter for the minimum number of assets you want to trade. But this function should only warn you and not fix an undiversified portfolio, because the only way would be to add more assets to trade and asset selection should be done by the strategy itself in my opinion.@support Hi, I just checked out
qnt 0.0.504and the problem I mentioned seems to be fixed now, thanks!
Would you perhaps consider to add a leverage check to thecheckfunction?
Because one might think "qnout.check says everything is OK, so I have a valid portfolio" while actually having vastly overleveraged like in my 2nd example whereweights.sum('asset').values.max()is505.0.
Adding something like this tocheckwould tell us about it:log_info("Check max portfolio leverage...") max_leverage = abs(output).sum(ds.ASSET).values.max() if max_leverage > 1 + 1e-13: # (give some leeway for rounding errors and such) log_err("ERROR! The max portfolio leverage is too high.") log_err(f"Max leverage: {max_leverage} Limit: 1.0") log_err("Use qnt.output.clean() or normalize() to fix.") else: log_info("Ok.") -
RE: Files disappeared from online envposted in Support
Bumping in here because something similar happened to me a few weeks ago. I had been training several neural networks and stored the trained models as pickle files online. A few days afterwards they were gone. I don't really need them any more but since it got mentioned now, I'm curious why this happened and how to prevent it in case one actually needs those files.
-
RE: Submission Issueposted in Support
Just out of curiousity I did some testing and it looks like the class actually was the culprit.
I submitted a simple strategy in 2 versions, one with a class and the other with a dictionary as state. The class version was rejected (exaclty like the one from my 1st post) and the dictionary version got accepted. -
Correlation Check always failsposted in Support
Hello,
whenever I run a backtest on the server I get the messageWARNING! Can't calculate correlation.
This has been happening since I started developing for the Q16 contest.
I don't know if this has any influence on the actual submission check and we'll soon have x times the quickstart template in the contest
Anyway, it would be good if the correlation check would work before we submitt algos that will eventually fail the correlation filter. -
RE: Different Sharpe ratios in backtest and competition filterposted in Support
I managed to implement it without global variables, now the sharpe ratio matches and it got accepted.
Thanks again!