How to filter ticker futures by sharpe
-
Hello,
I'm trying to apply ticker filters from stocks to futures, but it doesn't work. Below is my code
For stock:
import qnt.stats as qnstats

# data = qndata.stocks.load_ndx_data(tail = 17*365, dims = ("time", "field", "asset"))
data = qndata.stocks.load_ndx_data(min_date="2005-01-01")
def get_best_instruments(data, weights, top_size):
    # compute statistics:
    stats_per_asset = qnstats.calc_stat(data, weights, per_asset=True)
    # calculate ranks of assets by "sharpe_ratio":
    ranks = (-stats_per_asset.sel(field="sharpe_ratio")).rank("asset")
    # select top assets by rank "top_period" days ago:
    top_period = 1
    rank = ranks.isel(time=-top_period)
    top = rank.where(rank <= top_size).dropna("asset").asset

    # select top stats:
    top_stats = stats_per_asset.sel(asset=top.values)

    # print results:
    print("SR tail of the top assets:")
    display(top_stats.sel(field="sharpe_ratio").to_pandas().tail())

    print("avg SR = ", top_stats[-top_period:].sel(field="sharpe_ratio").mean("asset")[-1].item())
    display(top_stats)
    return top_stats.coords["asset"].values

get_best_instruments(data, weight, 15)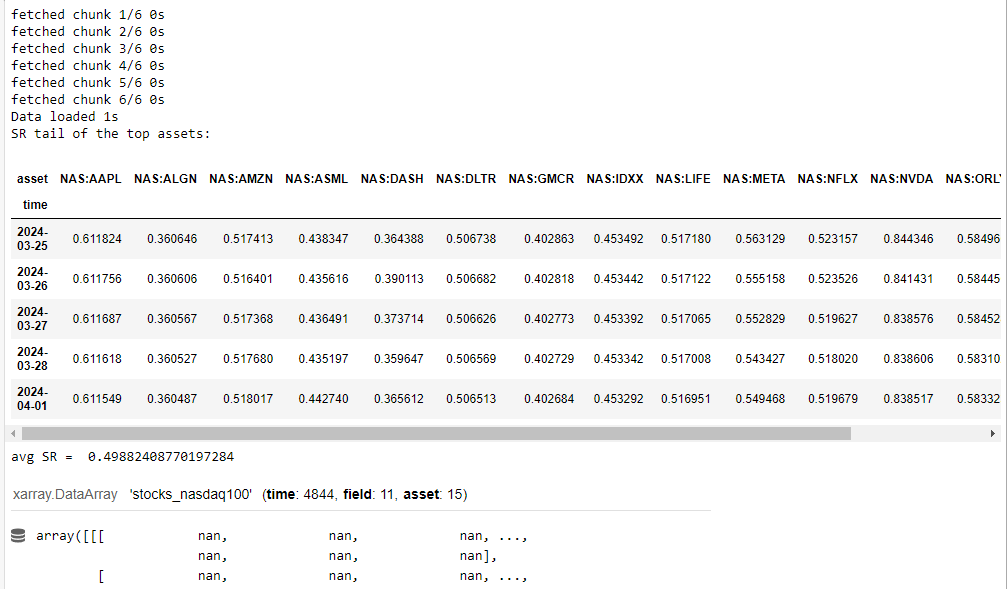
For futures
import qnt.stats as qnstats

# data = qndata.stocks.load_ndx_data(tail = 17*365, dims = ("time", "field", "asset"))
data = qndata.futures_load_data(min_date="2005-01-01")
def get_best_instruments(data, weights, top_size):
    # compute statistics:
    stats_per_asset = qnstats.calc_stat(data, weights, per_asset=True)
    # calculate ranks of assets by "sharpe_ratio":
    ranks = (-stats_per_asset.sel(field="sharpe_ratio")).rank("asset")
    # select top assets by rank "top_period" days ago:
    top_period = 1
    rank = ranks.isel(time=-top_period)
    top = rank.where(rank <= top_size).dropna("asset").asset

    # select top stats:
    top_stats = stats_per_asset.sel(asset=top.values)

    # print results:
    print("SR tail of the top assets:")
    display(top_stats.sel(field="sharpe_ratio").to_pandas().tail())

    print("avg SR = ", top_stats[-top_period:].sel(field="sharpe_ratio").mean("asset")[-1].item())
    display(top_stats)
    return top_stats.coords["asset"].values

get_best_instruments(data, weight, 15)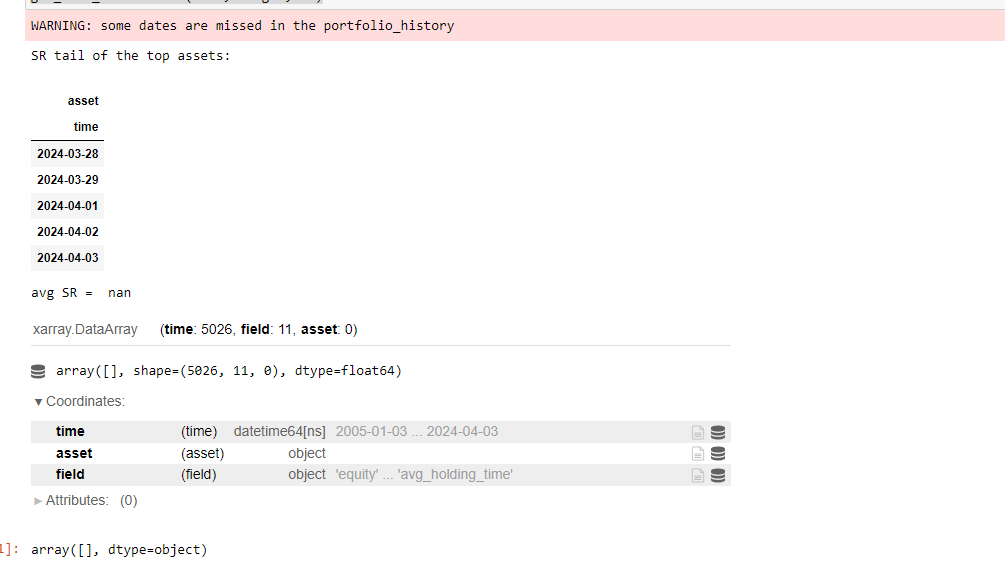
Please help me. I hope you can provide an example on how to filter ticker futures by sharpe similar to the get_best_instruments function. Thank you
-
@newbiequant96 said in How to filter ticker futures by sharpe:
import qnt.stats as qnstats
data = qndata.stocks.load_ndx_data(tail = 17*365, dims = ("time", "field", "asset"))
data = qndata.futures_load_data(min_date="2005-01-01")
def get_best_instruments(data, weights, top_size):
# compute statistics:
stats_per_asset = qnstats.calc_stat(data, weights, per_asset=True)
# calculate ranks of assets by "sharpe_ratio":
ranks = (-stats_per_asset.sel(field="sharpe_ratio")).rank("asset")
# select top assets by rank "top_period" days ago:
top_period = 1
rank = ranks.isel(time=-top_period)
top = rank.where(rank <= top_size).dropna("asset").asset# select top stats: top_stats = stats_per_asset.sel(asset=top.values) # print results: print("SR tail of the top assets:") display(top_stats.sel(field="sharpe_ratio").to_pandas().tail()) print("avg SR = ", top_stats[-top_period:].sel(field="sharpe_ratio").mean("asset")[-1].item()) display(top_stats) return top_stats.coords["asset"].valuesget_best_instruments(data, weight, 15)
Hello. I suppose there is an issue with the variable
weightin your code.Here is a working example with futures selection.
import qnt.data as qndata import qnt.stats as qnstats import qnt.ta as qnta data = qndata.futures_load_data(min_date="2005-01-01") def strategy(data, params): s_ = qnta.trix(data.sel(field='high'), params[0]) w_1 = s_.shift(time=params[1]) > s_.shift(time=params[2]) w_2 = s_.shift(time=params[3]) > s_.shift(time=params[4]) weights = (w_1 * w_2) return weights.fillna(0) weights = strategy(data, [196, 125, 76, 12, 192]) def get_best_instruments(data, weights, top_size): # compute statistics: stats_per_asset = qnstats.calc_stat(data, weights, per_asset=True) # calculate ranks of assets by "sharpe_ratio": ranks = (-stats_per_asset.sel(field="sharpe_ratio")).rank("asset") # select top assets by rank "top_period" days ago: top_period = 1 rank = ranks.isel(time=-top_period) top = rank.where(rank <= top_size).dropna("asset").asset # select top stats: top_stats = stats_per_asset.sel(asset=top.values) # print results: print("SR tail of the top assets:") display(top_stats.sel(field="sharpe_ratio").to_pandas().tail()) print("avg SR = ", top_stats[-top_period:].sel(field="sharpe_ratio").mean("asset")[-1].item()) display(top_stats) return top_stats.coords["asset"].values get_best_instruments(data, weights, 5) -
@vyacheslav_b said in How to filter ticker futures by sharpe:
data = qndata.futures_load_data(min_date="2005-01-01")
Here is my full code
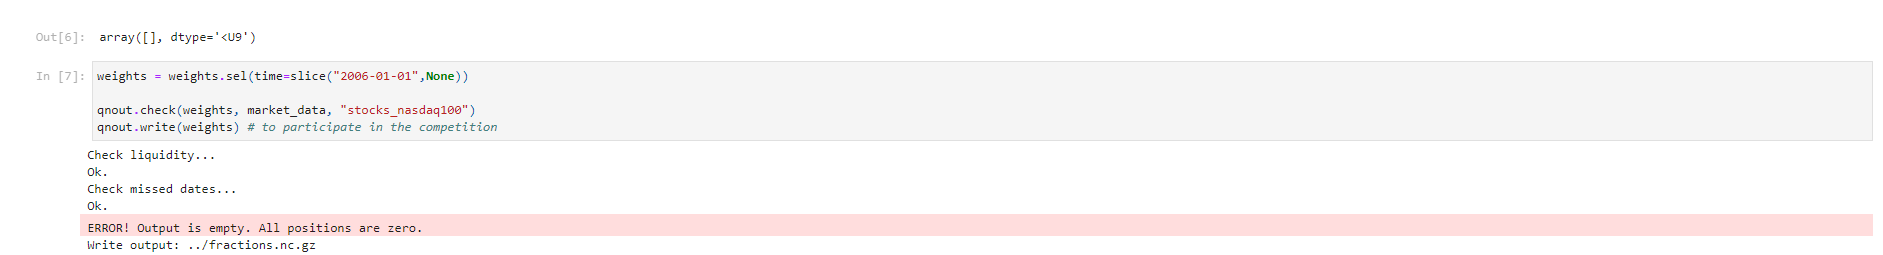
# Import basic libraries.
import xarray as xr
import pandas as pd
import numpy as np
# Import Quantiacs libraries.
import qnt.data    as qndata  # load and manipulate data
import qnt.output as qnout   # manage output
import qnt.backtester as qnbt # backtester
import qnt.stats   as qnstats # statistical functions for analysis
import qnt.graph   as qngraph # graphical tools
import qnt.ta      as qnta    # indicators library
import qnt.xr_talib as xr_talib   # indicators library

def load_data(period):
    futures = qndata.futures_load_data(tail=period)
    crypto = qndata.cryptofutures_load_data(tail=period)
    stocks = qndata.stocks.load_ndx_data(tail=period)
    return {"futures": futures, "crypto": crypto, "stocks": stocks}, futures.time.values


def window(data, max_date: np.datetime64, lookback_period: int):
    min_date = max_date - np.timedelta64(lookback_period, 'D')
    return {
        "futures": data['futures'].sel(time=slice(min_date, max_date)),
        "crypto": data['crypto'].sel(time=slice(min_date, max_date)),
        "stocks": data['stocks'].sel(time=slice(min_date, max_date)),
    }

def strategy(data):
    close = data['futures'].sel(field='close')
    close_prev = data['futures'].sel(field='close').shift(time=1)
    close_change = (close - close_prev)/close_prev

    close_stocks = data['stocks'].sel(field='close')
    close_stocks_prev = data['stocks'].sel(field='close').shift(time=1)
    close_change_stocks = (close_stocks - close_stocks_prev)/close_stocks_prev

    sma200 = qnta.lwma(close_change, 20).fillna(0).mean('asset').isel(time=-1)
    sma200_crypto = qnta.dema(close_change_stocks, 20).isel(time=-1)
    return xr.where(sma200 < sma200_crypto, 1, 0)

weight = qnbt.backtest(
    competition_type="stocks_nasdaq100",
    load_data=load_data,
    lookback_period=90,
    start_date='2006-01-01',
    strategy=strategy,
    window=window
)

import qnt.stats as qnstats

# data = qndata.stocks.load_ndx_data(tail = 17*365, dims = ("time", "field", "asset"))
data = qndata.futures_load_data(min_date="2005-01-01")
def get_best_instruments(data, weights, top_size):
    # compute statistics:
    stats_per_asset = qnstats.calc_stat(data, weights, per_asset=True)
    # calculate ranks of assets by "sharpe_ratio":
    ranks = (-stats_per_asset.sel(field="sharpe_ratio")).rank("asset")
    # select top assets by rank "top_period" days ago:
    top_period = 1
    rank = ranks.isel(time=-top_period)
    top = rank.where(rank <= top_size).dropna("asset").asset

    # select top stats:
    top_stats = stats_per_asset.sel(asset=top.values)

    # print results:
    print("SR tail of the top assets:")
    display(top_stats.sel(field="sharpe_ratio").to_pandas().tail())

    print("avg SR = ", top_stats[-top_period:].sel(field="sharpe_ratio").mean("asset")[-1].item())
    display(top_stats)
    return top_stats.coords["asset"].values

get_best_instruments(data, weight, 15)

weights = weight.sel(time=slice("2006-01-01",None))

qnout.check(weights, data, "stocks_nasdaq100")
qnout.write(weights) # to participate in the competition
I can filter tickers by stocks, but I cannot filter tickers by futures. Please take a look and help me
-
@newbiequant96 Hello. You have a problem with the variable
weight.You are predicting portfolio weights for stocks with this variable, but you are trying to select the best assets among futures.
If you want to filter by the best futures, then the variable should contain portfolio weights for futures. If you want to filter stocks, then the variable should contain portfolio weights for stocks.
In your code, you are predicting stocks and trying to find the best futures among them.
In this section, I provided an example of code on how to load stocks, futures, and cryptocurrencies together.
https://quantiacs.com/community/topic/556/is-it-possible-to-combine-stocks-with-crypto/2 -
@vyacheslav_b Thank you so much.
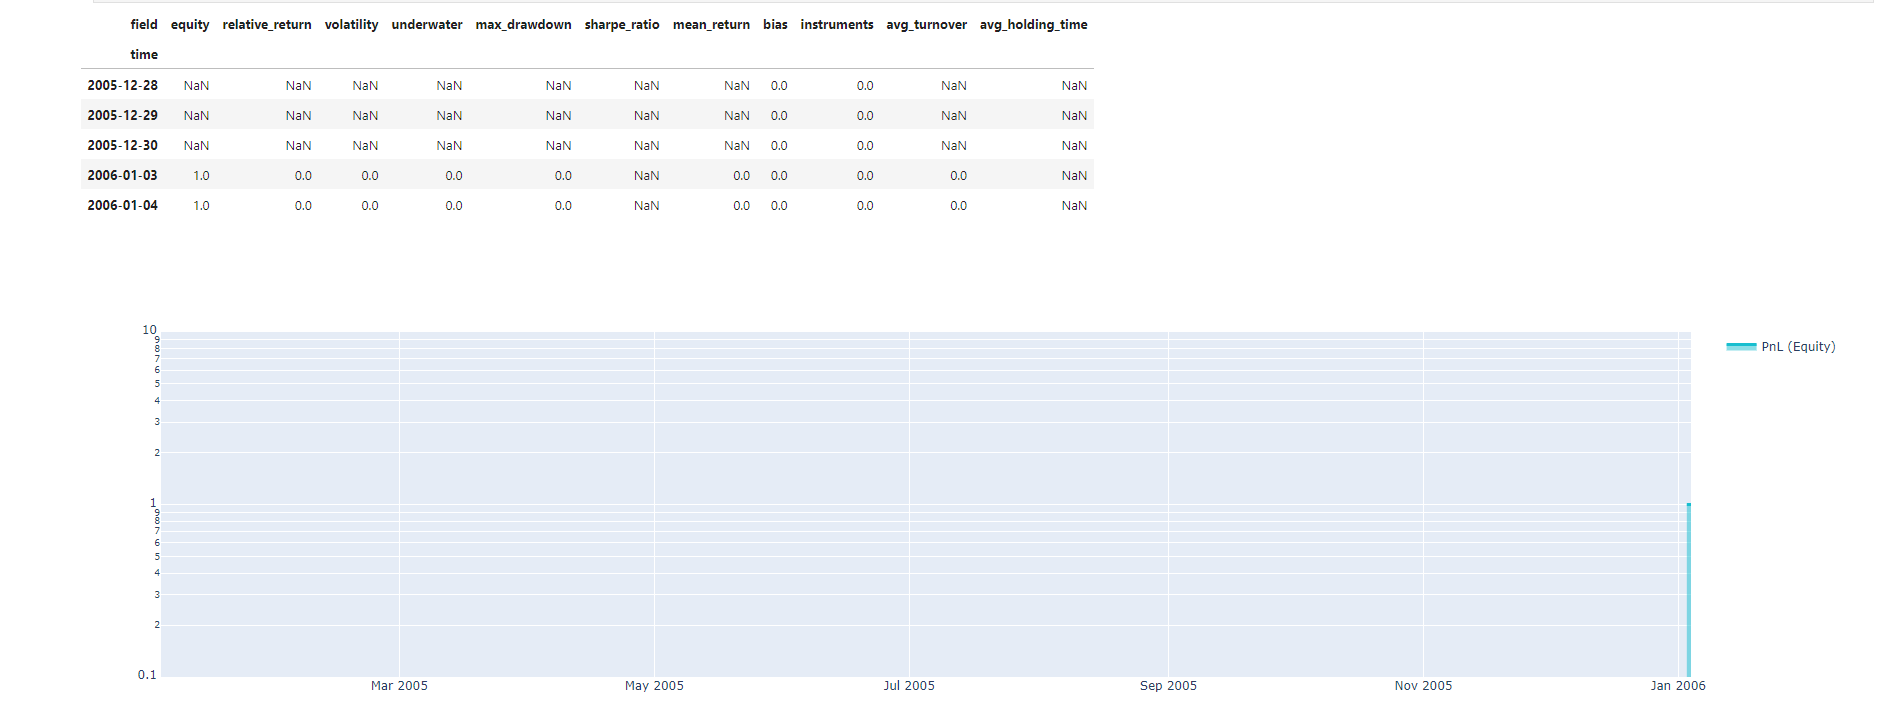
I have one more question for you to answer. I ran the precheck and the result was nan value the first time, but I set the min_date to 2005 - 01 - 01. I would like to ask, why is there a nan value problem? Is it because the ticker I chose had some companies that weren't listed at that time? My strategy id code is # 16767242. Thank you so much