Hello,
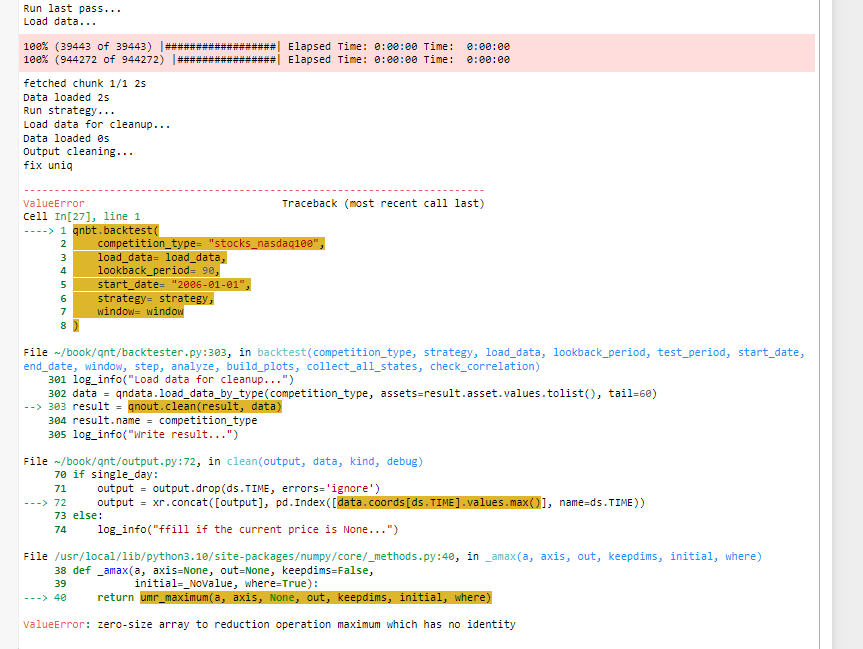
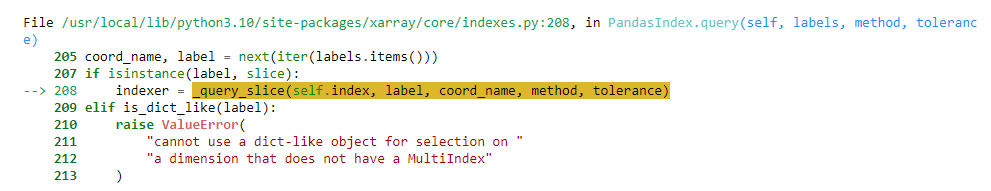
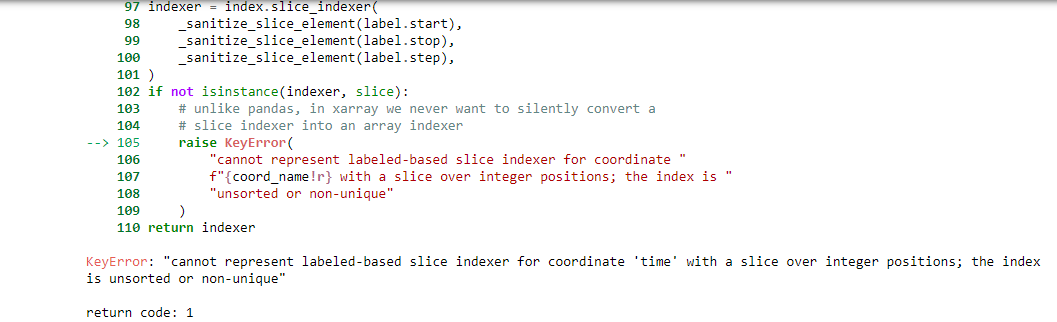
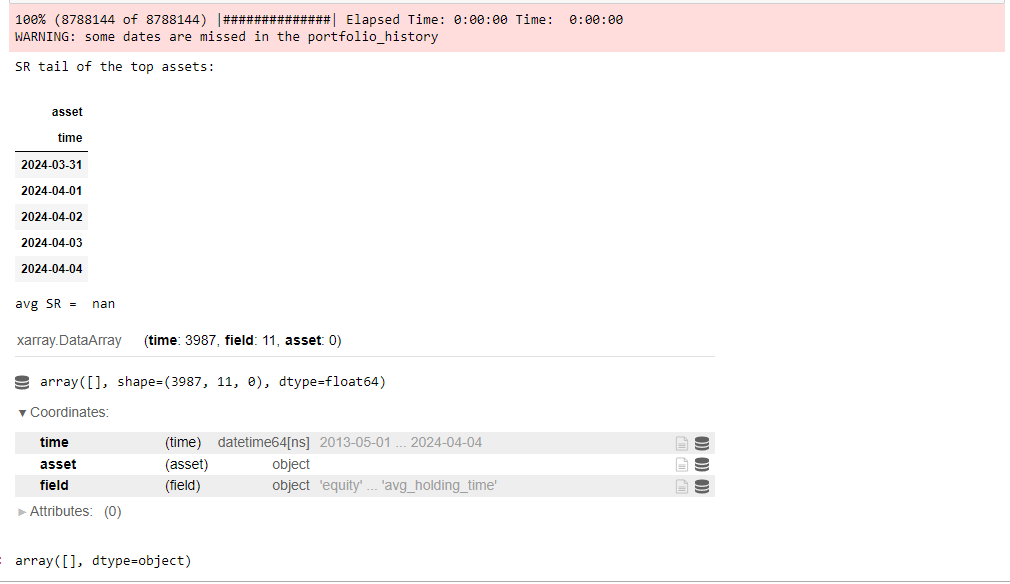
I'm testing combining crypto with stocks for Q21 but I'm getting an error. We hope to help.
Thank you.
Below is my code
# Import basic libraries.
import xarray as xr
import pandas as pd
import numpy as np
# Import Quantiacs libraries.
import qnt.data as qndata # load and manipulate data
import qnt.output as qnout # manage output
import qnt.backtester as qnbt # backtester
import qnt.stats as qnstats # statistical functions for analysis
import qnt.graph as qngraph # graphical tools
import qnt.ta as qnta # indicators library
import qnt.xr_talib as xr_talib # indicators library
def load_data(period):
futures = qndata.futures.load_data(tail=period).isel(asset=0)
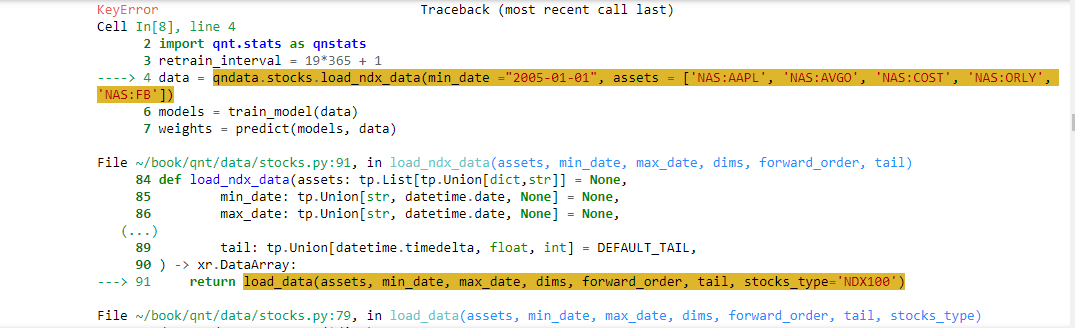
stocks = qndata.stocks.load_ndx_data(tail=period)
crypto= qndata.crypto.load_data(tail=period)
return {"futures": futures, "stocks": stocks, "crypto": crypto}, futures.time.values
def window(data, max_date: np.datetime64, lookback_period: int):
min_date = max_date - np.timedelta64(lookback_period, "D")
return {
"futures": data["futures"].sel(time=slice(min_date, max_date)),
"stocks": data["stocks"].sel(time=slice(min_date, max_date)),
"crypto": data["crypto"].sel(time=slice(min_date, max_date)),
}
def strategy(data):
close_futures = data["crypto"].sel(field="close")
close_stocks = data["stocks"].sel(field="close")
sma20 = qnta.sma(close_futures, 20).isel(time=-1)
sma20_stocks = qnta.sma(close_stocks, 20).isel(time=-1)
is_liquid = data["stocks"].sel(field="is_liquid").isel(time=-1)
weights = xr.where(sma20 < sma20_stocks, 1, -1)
weights = weights * is_liquid
weights = weights / 100.0
return weights
qnbt.backtest(
competition_type= "stocks_nasdaq100",
load_data= load_data,
lookback_period= 90,
start_date= "2006-01-01",
strategy= strategy,
window= window
)