Strategy trades illiquid instruments
-
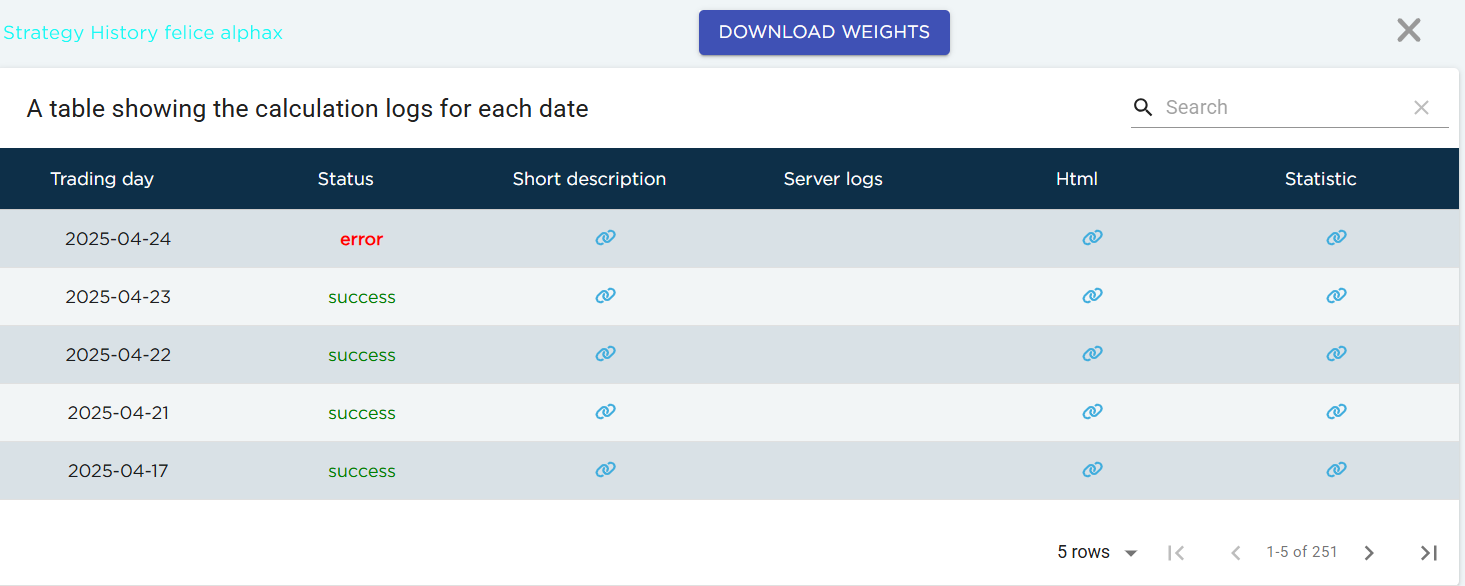
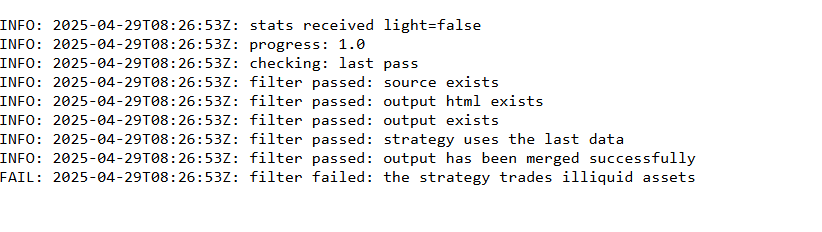
Hi, I am having problem Strategy trades illiquid instruments at latest date in log, while I have multiplied weight with liquid. I checked log only latest date has this error. Please help me. My stock universe is top 7 magnificent. @support @Vyacheslav_B
My alpha id is #18379797
-
This post is deleted! -
sorry for late answer, please check the correctness of dataset used for defining weights in strategy. Be sure that 'stocks_s&p500' dataset is used and not 'stocks_nasdaq100' for current competition. To ensure strategy trades only liquid assets in certain time period, multiply the output from your strategy function with 'is_liquid' field from correct dataset, or simply use clean() function from qnt.output:
import qnt.data as qndata
import qnt.output as qnout

def strategy(data):
    .....
    # liquid = data.sel(field='is_liquid')
    # weights = weights * liquid
    return weights


data = qndata.stocks_load_spx_data(min_date='2005-01-01')
weights = strategy(data)
weights = qnout.clean(weights, data, kind='stocks_s&p500')

qnout.write(weights)
Also, keep in mind that submission will not be eligible for contest if stocks universe (in this case "top 7 magnificent") is hand picked (manually defined).
Best regards,
-
@support Thanks for the feedback. I would like to ask the following, for example if I want to filter out the 10 tickers with the best sharpe of the strategy, how should I do it, to avoid being filtered by hand?
Please provide an example code
def filter_sharpe_ratio(data, weights, top_assets):
stats_per_asset = qnstats.calc_stat(data, weights, per_asset=True)
sharpe_ratio = stats_per_asset.sel(field="sharpe_ratio")
return qnfilter.rank_assets_by(data, sharpe_ratio, top_assets, ascending=False)asset_filter = filter_sharpe_ratio(data, weights, 150)
weights = weights * asset_filterI used this code, but the result is still nearly 300 tickers.
-
@illustrious-felice Hello. The reason you're still seeing a large number of tickers (e.g., around 300) even after applying the filter is that the "best" instrument by Sharpe ratio changes over time. The
rank_assets_byfunction returns a time-dependent mask, selecting the top N assets at each time step. So the total number of unique assets that were selected at any point in time may be much larger thantop_assets.This is expected behavior.
To illustrate this more clearly, let's consider a minimal working example that selects only 1 top asset at each point in time and shows all the intermediate steps:
import qnt.data as qndata
import qnt.ta as qnta
import qnt.stats as qnstats
import qnt.output as qnout
import qnt.filter as qnfilter
import xarray as xr
import pandas as pd

top_assets = 1

data = qndata.stocks.load_spx_data(min_date="2005-06-01")
weights = data.sel(field="is_liquid")

stats_per_asset = qnstats.calc_stat(data, weights, per_asset=True)
sharpe_ratio = stats_per_asset.sel(field="sharpe_ratio")
asset_filter = qnfilter.rank_assets_by(data, sharpe_ratio, top_assets, ascending=False)

weights = weights * asset_filter
stats = qnstats.calc_stat(data, weights.sel(time=slice("2005-06-01", None)))

display(asset_filter.to_pandas().tail())
display(stats.to_pandas().tail())
display(sharpe_ratio.to_pandas().tail())
display(weights.to_pandas().tail())
If you want to see which asset was the best on specific dates, you can do something like this:
dates = ["2015-01-15", "2020-01-15", "2025-01-15"]
records = []

for date_str in dates:
    best_mask = asset_filter.sel(time=date_str)
    assets = best_mask.where(best_mask > 0, drop=True).asset.values
    srs = sharpe_ratio.sel(time=date_str, asset=assets).values
    for a, s in zip(assets, srs):
        records.append({"time": date_str, "asset": a.item(), "sharpe_ratio": float(s)})

df = pd.DataFrame(records).set_index("time")
display(df)
asset sharpe_ratio time 2025-05-22 NYS:HRL 1.084683 2025-05-22 NAS:KDP 1.093528 2025-05-22 NAS:AAPL 0.968039Or simply for a single date:
date = "2020-05-22"
best_mask = asset_filter.sel(time=date)
best_assets = best_mask.where(best_mask > 0, drop=True).asset
best_sr = sharpe_ratio.sel(time=date, asset=best_assets)
print(best_sr.to_pandas())
This shows clearly that only one asset is selected at each time step, but over the full time range, many different assets can appear in the top list depending on how their Sharpe ratios change.