Optimization
Backtesting a trading system means simulating the trading rules on historical data. All trading rules depend on some set of parameters, for example the lookback periods for technical indicators or the hyperparameters of a machine learning model.
Single-pass strategy example
In a single-pass strategy, all data is accessed at once. This implementation is fast and speeds up the parametric scan.
You should make sure that your strategy is not implicitly forward looking before submission, see how to prevent forward looking.
The strategy is going long only when the rate of change in the last roc_period trading days (in this case 10) of the linear-weighted moving average over the last wma_period trading days (in this case 20) is positive.
import qnt.data as qndata
import qnt.ta as qnta
import qnt.output as qnout
import qnt.stats as qns
import qnt.log as qnlog

import xarray as xr

def single_pass_strategy(data, wma_period=20, roc_period=10):
    wma = qnta.lwma(data.sel(field='close'), wma_period)
    sroc = qnta.roc(wma, roc_period)
    weights = xr.where(sroc > 0, 1, 0)
    weights = weights / len(data.asset) # normalize weights so that sum=1, fully invested
    with qnlog.Settings(info=False, err=False): # suppress log messages
        weights = qnout.clean(weights, data) # check for problems
    return weights
We recommend optimizing your strategy in a separate notebook than the one you want to submit, as parametric scan is very time consuming.
Alternatively it is possible to mark the cells which perform scans using the #DEBUG# tag. When you submit your notebook, the backtesting engine which performs the evaluation on the Quantiacs server will skip these cells.
We call the function optimize_strategy, which runs a parametric scan over pre-defined ranges of arguments for our strategy (in this case single_pass_strategy). In our example the arguments are wma_period and roc_period. The function full_range_args_generator generates all possible combinations of arguments in the specified (min, max, step) range.
So basically optimize_strategy executes single_pass_strategy with mutliple possible arguments and stores the results.
#DEBUG#
# evaluator will remove all cells with this tag before evaluation

import qnt.optimizer as qnop

data = qndata.futures.load_data(min_date='2004-01-01') # indicators need warmup, so prepend data

result = qnop.optimize_strategy(
    data,
    single_pass_strategy,
    qnop.full_range_args_generator(
        wma_period=range(10, 150, 5), # min, max, step
        roc_period=range(5, 100, 5)   # min, max, step
    ),
    workers=1 # you can set more workers when you run this code on your local PC to speed it up
)
When you work locally, you can use workers > 1 to speed up the process by using parallelization. Use workers=os.cpu_count() for optimal performance.
build_plot(result) constructs an interactive chart of the results (statistical indicators) depending on the chosen tuple of arguments:
import qnt.optimizer as qnop

qnop.build_plot(result) # interactive chart in the notebook
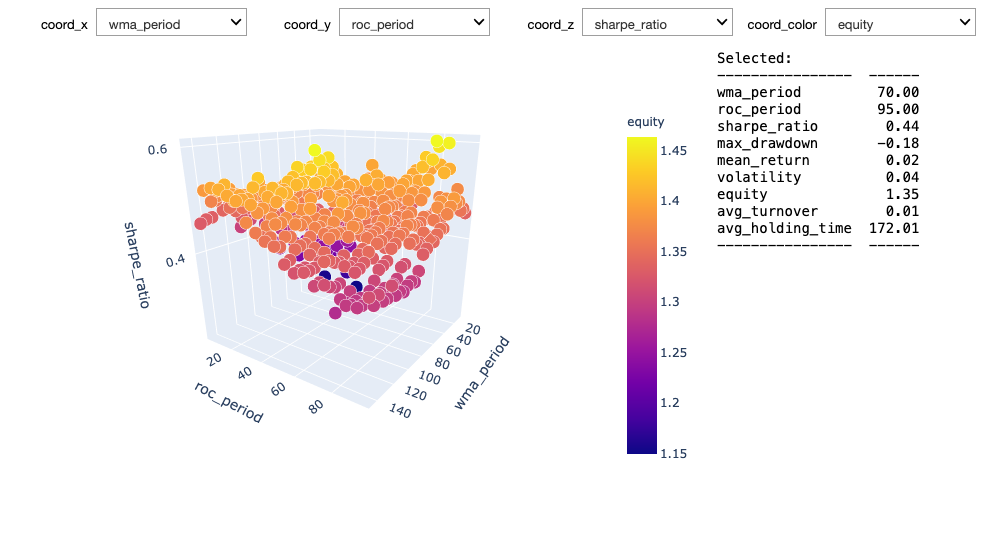
As a reference, we display the iteration with the highest score (Sharpe ratio):
print("Best iteration:")
display(result['best_iteration'])
Best iteration:

{'args': {'wma_period': 20, 'roc_period': 80},
 'result': {'equity': 1.454357413490685,
  'relative_return': -0.0022028115784406,
  'volatility': 0.03950151054490127,
  'underwater': -0.0033983347177664047,
  'max_drawdown': -0.1211117497323877,
  'sharpe_ratio': 0.5816109271207632,
  'mean_return': 0.022974510170690632,
  'bias': 1.0,
  'instruments': 71.0,
  'avg_turnover': 0.015183419860354838,
  'avg_holding_time': 87.05269121813073},
 'weight': 0.5816109271207632,
 'exception': None}
The arguments for the iteration with the highest score (Sharpe ratio) can be later defined manually or by calling result[’best_iteration’][’args’] for the final strategy. Note that cells with the tag #DEBUG# are disabled.
A final multi-pass call backtest for the optimized strategy with the desired parameters would be:
import qnt.backtester as qnbt

best_args = {'wma_period': 20, 'roc_period': 80}
# or: best_args = result['best_iteration']['args']

def best_strategy(data):
    return single_pass_strategy(data, **best_args).isel(time=-1)

weights = qnbt.backtest(
    competition_type="futures",
    lookback_period=2 * 365,
    start_date='2006-01-01',
    strategy=best_strategy,
    analyze=True,
    build_plots=True
)
Note: A parameter choice which maximizes the value of the Sharpe ratio when the simulation is performed on the past data is a source of backtest overfitting and can lead to poor performance on live data.
Optimizer function
Function
import qnt.optimizer as qnop

qnop.optimize_strategy(
    data,
    strategy,
    argument_generator,
    stats_function=None,
    stats_to_weight=None,
    workers=1
)
Parameters
| Parameter | Explanation |
|---|---|
| data | xarray.DataArray with input data. |
| strategy | strategy function, accepts data and other parameters and returns weights for all assets for the last day. |
| argument_generator | argument generator for additional arguments for strategy function |
| stats_function | calculate statistics for one pass (defaults to calculate all statistics seen below) (see Stats Function) |
| stats_to_weight | converts statistics to weight in order to select the best iteration (defaults to weight is sharpe ratio) |
| workers | amount of processes to spawn for parallelization (try: workers=os.cpu_count() ) |
If you want to optimize over something different than Sharpe Ratio, you would need to pass a stats_to_weight function as a parameter to optimize_strategy. See Stats to Weight to see how such a function can be implemented.
Output
The function returns a dictionary with performance metrics and weight for each parameter tuple tried (’iterations’), as well as the best result (highest weight) (’best_iteration’). :
{'iterations': [{'args': {'wma_period': 10, 'roc_period': 5},
   'result': {'equity': 1.150857800857179,
    'relative_return': -0.0005426066585509925,
    'volatility': 0.040316492756790695,
    'underwater': -0.006563103714664287,
    'max_drawdown': -0.1280956832093425,
    'sharpe_ratio': 0.22026220205338382,
    'mean_return': 0.008880199473680017,
    'bias': 1.0,
    'instruments': 71.0,
    'avg_turnover': 0.07616475561830197,
    'avg_holding_time': 13.492355016737367},
   'weight': 0.22026220205338382,
   'exception': None},
   ...],
   'best_iteration': {'args': {'wma_period': 20, 'roc_period': 80},
  'result': {'equity': 1.461222328612549,
   'relative_return': 0.0018561181085214873,
   'volatility': 0.04026537419444597,
   'underwater': -0.003009583352372447,
   'max_drawdown': -0.12108332730734217,
   'sharpe_ratio': 0.5998114103212379,
   'mean_return': 0.024151630882683017,
   'bias': 1.0,
   'instruments': 71.0,
   'avg_turnover': 0.01518981991802005,
   'avg_holding_time': 87.11481900452533},
  'weight': 0.5998114103212379,
  'exception': None}}
Use
import qnt.optimizer as qnop

result = qnop.optimize_strategy(
    data,
    strategy,
    argument_generator,
    workers=1
)

qnop.build_plot(result)
for an interactive chart of the result
Stats function
If you want different statistics than the standard metrics, write a function with this skeleton and pass it to optimize_strategy (e.g. stats_function=stats_function):
def stats_function(data, output):
    """
    Calculates statistics for the iteration output.
    :param data: market data
    :param output: weights
    :return: dictionary of statistics
    """
Stats to weight
If you want to optimize over Equity instead of Sharpe Ratio, for example, define a function like this:
import math
def stats_to_weight_equity(stat):
    """
    Converts the statistics to weight.
    :param stat: dictionary of statistics
    """
    res = stat.get('equity', float('-inf')) #instead of 'equity' you can choose any metric
                                            #returned by the used stats_function
    if math.isfinite(res):
        return res
    else:
        return float('-inf')
and then pass that function to optimize_strategy (example: stats_to_weight=stats_to_weight_equity)
Argument generators
Examples:
qnop.full_range_args_generator( #all possible combinations
    wma_period=range(10, 150, 5), # min, max, step
    roc_period=range(5, 100, 5)   # min, max, step
)
qnop.random_range_args_generator( #random distributed combinations
    100,                       # number of samples
    wma_period=range(10, 150), # min, max
    roc_period=range(5, 100)   # min, max
)